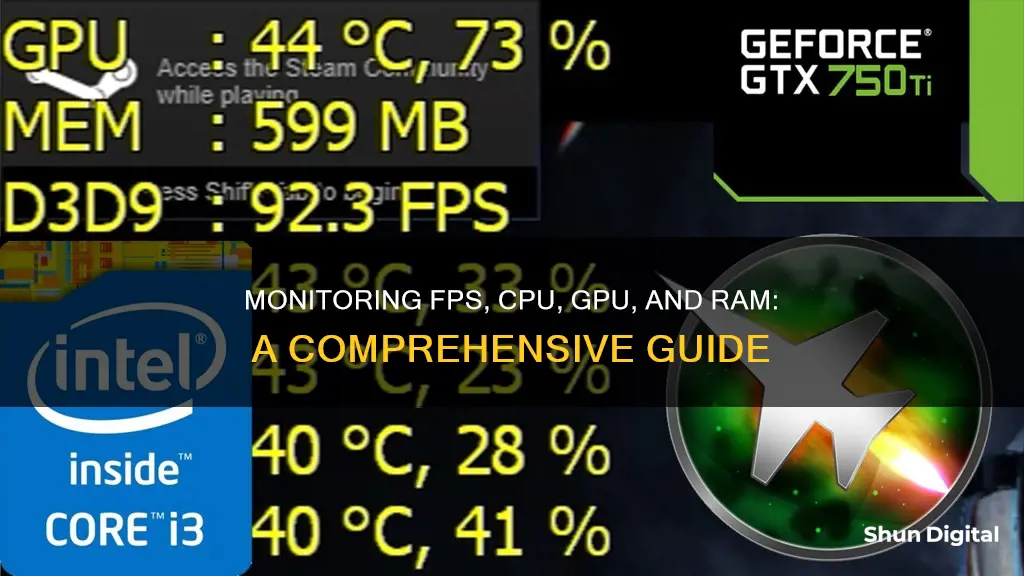
Monitoring your computer's performance is essential, especially if you're a gamer. You can easily track your hardware's real-time performance, including the graphics card, processor, and system in general, by monitoring your FPS, CPU, GPU, and RAM usage. This can help you identify performance issues and make necessary adjustments to improve your gameplay. There are several tools available to help you monitor your system, including third-party software and built-in features.
| Characteristics | Values |
|---|---|
| How to monitor FPS | Use a third-party tool such as MSI Afterburner, Fraps, FPS Monitor, or Radeon Software |
| How to monitor CPU usage | Use a third-party tool such as MSI Afterburner, Radeon Software, or CPU-Z |
| How to monitor GPU usage | Use a third-party tool such as MSI Afterburner, Radeon Software, or CPU-Z |
| How to monitor RAM usage | Use a third-party tool such as MSI Afterburner or Radeon Software |
What You'll Learn

Use MSI Afterburner and Rivatuner Statistics Server
To monitor your FPS, CPU, GPU, and RAM usage while gaming, you can use MSI Afterburner along with Rivatuner Statistics Server (RTSS). This combination of programs is generally the quickest and easiest way to get an overlay working, and they are awesome tools.
Here's a step-by-step guide on how to set up and use MSI Afterburner with RTSS:
Step 1: Download and Install MSI Afterburner
Download MSI Afterburner, which is a GPU tuning utility. It comes packaged with Rivatuner Statistics Server (RTSS), which is required for the On-Screen Display (OSD). During the installation process, make sure to select both MSI Afterburner and RTSS when choosing components.
Step 2: Configure the OSD Settings
Once the installation is complete, run both MSI Afterburner and RTSS. Ensure that any other GPU tuning utilities are turned off.
Now, open Afterburner and click the Settings icon (usually a cog icon below Fan Speed (%)). In the Settings window, navigate to the “Monitoring” tab. Here, you will find various settings and options.
The section you want to focus on is "Active hardware monitoring graphs." This is where you will enable or disable the statistics you want to be displayed on your OSD.
To add or remove graphs from your OSD, you can either go through each item individually and tick or untick "Show in On-Screen Display." Alternatively, you can select multiple items by holding Ctrl and clicking on multiple graphs or by holding Shift and selecting a group of graphs. Then, tick "Show in On-Screen Display" to add the selected items.
If you want to add multiple items that are grayed out (unticked), you can use Ctrl+click on the checkmark to activate or deactivate your selections.
Step 3: Set Up Rivatuner Statistics Server (RTSS)
Open RTSS and ensure that "Show On-Screen Display" and "On-Screen Display Support" are both set to On. These settings are typically enabled by default.
You can further customize the appearance of your OSD within RTSS. You can adjust the overall zoom, colors, the corner in which it appears, and even the font. You can also set up custom profiles per application if needed.
Step 4: Test Your On-Screen Display (OSD)
Start a game and ensure that both RTSS and Afterburner are running for your OSD to function. Most settings can be changed while a game is running, so you can make adjustments on the fly if needed.
If your OSD appears correctly, you have successfully set up your own On-Screen Display. You can now monitor your GPU, CPU, and RAM usage, as well as see other metrics like 1% and 0.1% lows for FPS and frametimes.
By following these four steps, you can easily set up MSI Afterburner with RTSS to monitor your FPS, CPU, GPU, and RAM usage while gaming. This will help you keep an eye on your system's performance and make any necessary adjustments to optimize your gaming experience.
Monitoring App Usage: Regulating Screen Time and Freedom
You may want to see also

Use the Xbox Game Bar overlay
The Xbox Game Bar is a customizable gaming overlay built into Windows 10 and Windows 11. It works with almost all PC games, giving you access to widgets for screen capture and sharing, controlling your music, chatting with Xbox friends, and more.
To open the Xbox Game Bar overlay, press the Win + G keys on your keyboard. Alternatively, if you are using an Xbox controller, you can push the Xbox button to launch the Game Bar. This should work by default, but if it doesn't, go to Settings > Gaming > Xbox Game Bar and ensure the "Open Xbox Game Bar using this button on a controller" switch is turned on.
The Performance widget in the Xbox Game Bar shows information about the utilisation of resources, including processor (CPU), graphics card (GPU), RAM (memory), and number of FPS (frames per second). You can also click the Pin icon on any open window to keep it visible on the screen, even when the Game Bar disappears.
Hit the Performance options icon at the top of the Performance widget to customise the window's positioning, transparency, and colour. You can also remove any metrics you don't want to be displayed.
Monitoring Bandwidth Usage: Track IP Address Activity
You may want to see also

Use GeForce Experience
If you have an Nvidia graphics card, you can use the Nvidia app, which combines GeForce Experience and the Nvidia Control Panel. To use GeForce Experience to monitor your FPS, CPU, GPU, and RAM usage, follow these steps:
- Open the Nvidia GeForce Experience on your computer and ensure your graphics card drivers are up-to-date.
- Open the settings by selecting the gear icon in the top right corner.
- In the settings, check the box to enable experimental features.
- Ensure the In-Game Overlay is enabled, then select Settings.
- In the In-Game Overlay settings, select HUD Layout.
- In HUD Layout, select Performance.
- Now you can configure the location and the performance information to be displayed.
Once you have followed these steps, you will be able to monitor your FPS, CPU, GPU, and RAM usage while gaming.
Monitoring Bandwidth Usage: Airport Extreme Edition
You may want to see also

Use Radeon Software
If you have an AMD graphics card, you can use Radeon Software to monitor your FPS, CPU, GPU, and RAM usage. Here's how to set it up:
Step 1: Open Radeon Software
Locate the Radeon Software application on your computer and open it. This program is specifically designed for AMD graphics cards, so make sure you have an AMD card installed before proceeding.
Step 2: Navigate to the Performance Tab
Once the application is open, click on the "Performance" tab at the top of the window. This is where you will find the settings related to performance monitoring.
Step 3: Enable the Tracking Tab
Under the "Performance" tab, you should see the "Tracking" tab. Click on it to enable the tracking options for various performance metrics.
Step 4: Select the Metrics to Monitor
In the "Tracking" tab, you will find options to enable monitoring for FPS, GPU, VRAM, GPU, and RAM. Make sure to select all the metrics you want to track. These options allow you to customize the data that will be displayed in your overlay.
Step 5: Enable the Overlay
Click on the "Overlay" tab and then enable the "Show Metrics Overlay" option. This will allow the performance metrics to be displayed on your screen as an overlay when you are playing games.
Step 6: Launch a Game
After configuring the settings in Radeon Software, launch any game to test the overlay. The performance metrics you selected should now appear in the corner of your screen.
With these steps, you can effectively use Radeon Software to monitor your FPS, CPU, GPU, and RAM usage while gaming. This can help you identify any performance bottlenecks and make informed decisions about potential upgrades to your system.
Battery-Sapping Security Apps: Monitor Your Usage
You may want to see also

Use third-party tools like Fraps, FPS Monitor, or PlayClaw
If you're looking for a more comprehensive solution, third-party tools like Fraps, FPS Monitor, or PlayClaw are excellent options. These tools offer a wide range of features to enhance your gaming experience and provide detailed performance metrics.
Let's start with Fraps, a universal Windows application that works with games using DirectX or OpenGL graphic technology. Fraps can display the Frames Per Second (FPS) count in the corner of your screen, allowing you to benchmark and measure your frame rate. It also includes screen capture capabilities, letting you take screenshots with a simple keypress, and video capture functionality, enabling you to record audio and video during gameplay. Fraps offers a free version and a paid unrestricted full version.
FPS Monitor is another powerful tool that tracks your PC's hardware state and displays this information as an overlay in-game. It shows an FPS counter and various other parameters, giving you a clear overview of your hardware performance while gaming. You can configure the appearance of the overlay, including font, size, style, and colour, to suit your preferences. Additionally, FPS Monitor collects hardware usage statistics, which you can analyse further, and provides hardware alerts to warn you when your system is running in a dangerous state.
PlayClaw, the more advanced version of FPS Monitor, offers even more features. It includes built-in game recording and streaming capabilities, making it a must-have tool for gamers who want to share their gameplay experiences. PlayClaw supports streaming to popular platforms such as Twitch and YouTube. One of its standout features is the graphics overlay support, allowing you to see various gaming overlays on your screen during gameplay or streaming.
By using any of these third-party tools, you'll have access to detailed performance metrics and a range of customisation options to enhance your gaming experience and troubleshoot any performance issues you may encounter.
Monitoring Xbox Usage: Remote Control for Parents
You may want to see also
Frequently asked questions
You can use a third-party tool such as MSI Afterburner, which also comes packaged with Rivatuner Statistics Server (RTSS). This software allows you to monitor FPS, CPU, GPU, and memory usage, and can be customised to display an on-screen overlay while gaming.
Alternatively, you can use the Xbox Game Bar overlay on Windows, or built-in tools from Nvidia or AMD.
Monitoring this data can help you identify performance issues and optimise your gameplay. For example, you can use the data to determine which component is the bottleneck in your system, and where you would benefit most from an upgrade.
First, download and install MSI Afterburner and RTSS. Then, configure the OSD settings by selecting the statistics you want to be displayed. Next, customise your RTSS settings, such as the overall zoom, colours, and corner in which it appears. Finally, launch a game and test your OSD.
Yes, a low FPS can be caused by a poor CPU, even if you have a great graphics card. Upgrading your CPU may help improve your FPS.


