Performance monitoring is a crucial aspect of IT systems management, offering insights into hardware and software performance to ensure optimal functionality. While the specific features vary depending on the tool and complexity of the environment, there are three key features that are essential for effective performance monitoring:
1. Server Monitoring: This involves tracking core areas such as CPU utilisation, local disk I/O and space, and memory usage. CPU utilisation refers to the percentage of processor capability being used. Local disk I/O indicates how much onboard storage is being utilised and the throughput level achieved. Monitoring local disk space entails tracking the percentage of total onboard storage in use. Memory monitoring measures the percentage of total system memory that is used and free.
2. Network Monitoring: This addresses key performance elements, including total bandwidth consumption (inbound and outbound), the number of transmitted packets, and the incidence of packet errors. By evaluating these factors, administrators can identify potential issues and ensure efficient data transmission.
3. Storage Monitoring: This focuses on shared storage devices, monitoring and reporting on array availability and performance, data volumes and their status, and array capacity usage. Given that storage devices are shared across multiple applications, tracking their status is critical. Monitoring data volumes and their status is essential as arrays support multiple volumes tied to specific applications. Additionally, keeping track of array capacity usage helps prevent common issues like running out of storage space.
| Characteristics | Values |
|---|---|
| Business performance metrics | ROI indicators, profitability, productivity |
| Sales performance metrics | Activity, lead generation, sales productivity |
| Project management performance metrics | Productivity, scope of work, quality and satisfaction, cost, gross margin |
| Employee performance metrics | Quality, quantity, efficiency, productivity |
What You'll Learn

Server monitoring
Requests per Second (RPS)
The primary function of a server is to receive and process requests. RPS is a metric that calculates the number of requests received during a specified monitoring period, typically ranging from one to five minutes. By evaluating RPS, you can gain insights into the server's capacity and identify potential bottlenecks. A high RPS value indicates a heavy server load, which may lead to performance degradation if not adequately managed.
Average Response Time (ART)
ART measures the average time it takes for the server to respond to a request. This metric provides a strong indicator of the overall performance and usability of the application running on the server. Generally, a lower ART value is preferable, as it suggests faster response times and a seamless user experience. However, it's important to note that ART is just an average, and unusual circumstances or slow components can skew the metric.
Peak Response Time (PRT)
While ART gives a general overview of server performance, PRT helps identify specific performance issues. PRT measures the longest response time during a given monitoring period. By comparing ART and PRT, you can determine if there are significant discrepancies. If the PRT is significantly higher than the ART, it indicates that one of the requests took considerably longer and may be an anomaly. Consistently high values for both ART and PRT suggest underlying server performance problems.
In addition to these three key features, there are other important metrics to consider for comprehensive server monitoring. These include server uptime, error rate, thread count, hardware utilization, and security-related metrics. By regularly monitoring these metrics and addressing any issues, IT teams can ensure optimal server performance and maintain a positive user experience.
Connecting a Desktop to a Projector: Monitor Setup
You may want to see also

Network monitoring
- Real-time Performance Metrics
- Automatic Device Discovery
An effective network monitoring tool should have the capability to automatically discover devices as they are added to the network. This saves users from having to manually scan for new devices. By having a clear picture of every device and connection, the monitoring solution can provide more accurate insights and help troubleshoot issues efficiently.
Intelligent Real-time Alerts
Alerts are a crucial aspect of network monitoring. The monitoring tool should be able to deliver intelligent, real-time alerts to the relevant network engineer or administrator when it detects an issue. These alerts should provide critical information such as the location and severity of the problem, enabling the IT team to prioritize and resolve the issue promptly.
In addition to these three key features, other important aspects of network monitoring include issue diagnosis and root cause analysis, customizable dashboards, and the ability to draw visual representations of the network, known as network maps. By incorporating these features into their network monitoring solutions, businesses can enhance their ability to maintain high-performing and reliable networks.
The Perfect Wallpaper Setup for Three Monitors
You may want to see also

Storage monitoring
Benefits of Storage Monitoring
- Better visibility: It provides IT staff with a unified interface or dashboard to monitor storage operations in real time and over the long term.
- Better performance: By optimising storage systems, end users experience reduced latency and performance bottlenecks, as well as increased throughput, resulting in improved productivity.
- Higher uptime levels: Storage monitoring enhances alerting capabilities, enabling IT staff to discover and address errors before they become critical issues.
- Reduced risk of data loss: By avoiding equipment failures, the chances of data loss are minimised.
- Better capacity planning: Real-time insights into available storage help IT departments plan for storage capacity expansion more effectively.
- Lower cost of ownership: Smoothly operating storage systems result in fewer crises, reducing overtime, emergency hardware purchases, and overall storage-related expenses.
Key performance indicators (KPIs) and metrics for storage monitoring include:
- Latency: This measures the responsiveness of a storage device to read/write requests, typically in milliseconds.
- Throughput: The number of bytes read from or written to the device per second.
- Input/Output Operations Per Second (IOPS): The number of read and write operations completed by the device each second.
- Utilization: Indicates the CPU utilisation of the SAN, measuring the time spent processing storage requests.
- Queue length: The number of pending input and output requests, which can indicate potential bottlenecks.
- Capacity available: Measures the amount of empty space on a storage device.
Challenges in Storage Monitoring
- Data storage growth: Managing explosive data growth while maintaining reliability and performance.
- User mobility: The challenge of monitoring and managing storage on remote devices, such as laptops and smartphones.
- Security: The need for enhanced security measures to protect against malicious attacks, with encryption impacting performance.
- The cloud: The shift to cloud storage masks visibility into storage systems, requiring new strategies to ensure responsiveness.
Best Practices for Storage Monitoring
To overcome these challenges and optimise storage monitoring, consider the following best practices:
- Understand data usage patterns: Analyse your organisation's data usage habits and patterns to align storage monitoring with user needs.
- Use centralised dashboards: Employ storage management tools with centralised dashboards, especially if data is stored in multiple locations or with multiple vendors.
- Optimise storage usage: Use monitoring statistics to redistribute datasets across devices, improving overall performance and reducing constraints.
- Consider compression: Evaluate whether compression can be used to improve performance and increase available storage capacity.
- Predict future trends: Utilise storage metrics to forecast capacity expansion and plan accordingly.
- Monitor backup devices: Treat backup devices with the same level of monitoring as primary storage devices.
- Select appropriate storage monitoring tools: Choose tools that fit your specific needs, such as NAS Monitoring, SAN Monitoring, Virtual Storage Monitoring, and Network Monitoring.
Removing Monitor Back Backdrops: A Step-by-Step Guide
You may want to see also

Software monitoring
- Real-Time Performance Monitoring: This involves using tools to measure and display the current performance of a system, providing up-to-date information such as CPU usage, memory utilisation, and network activity. Examples include Task Manager and Performance Monitor for Windows, and Process Status and Top for Unix-based systems. These tools help identify issues and ensure optimal resource allocation.
- Log-Based Performance Monitoring: This approach focuses on recording system performance data for subsequent analysis to identify trends and patterns. Log-based monitoring tools, such as Event Log Service and Performance Logs in Windows, and System Activity Reporter in Unix, enable thorough evaluation of system performance, helping to optimise and debug processes. They provide detailed records that can be used for performance comparisons and predictions.
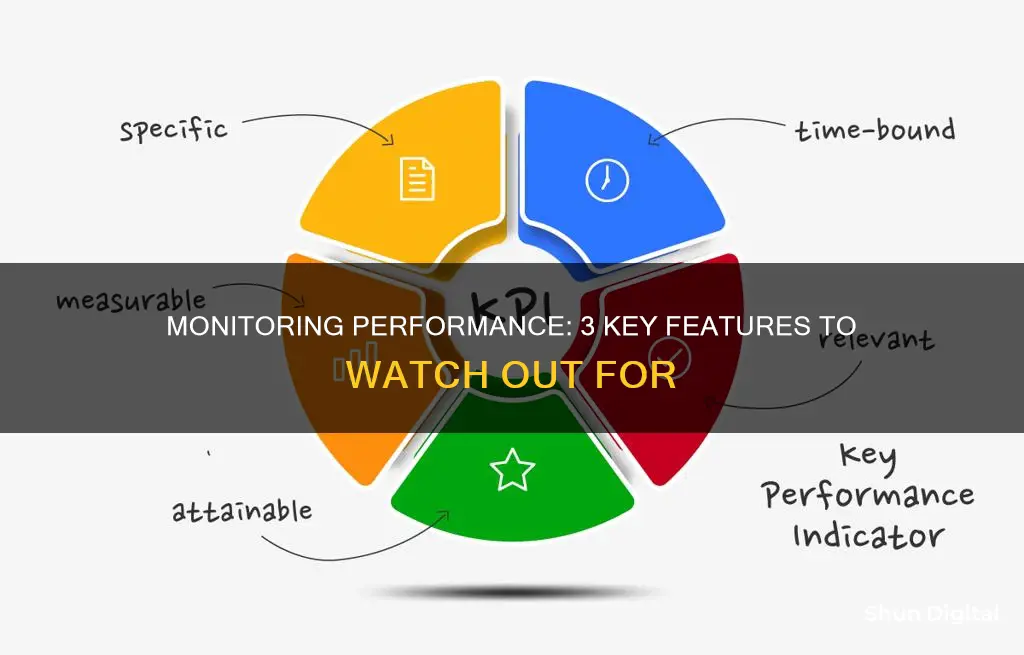
- Application Performance Metrics: These metrics, also known as Key Performance Indicators (KPIs), provide quantitative insights into the effectiveness of software applications. Examples include CPU usage, memory usage, latency, user satisfaction scores, average response time, and throughput. Monitoring these metrics helps identify areas for improvement, optimise resource utilisation, and ensure a positive user experience.
Blind Spot Monitoring: Standard Feature on All Nissan Rogues?
You may want to see also

Hardware monitoring
Server Monitoring:
Server monitoring is crucial, and it should encompass at least four key areas: CPU utilisation, local disk I/O, local disk space, and memory. CPU utilisation refers to the percentage of processor capability being used. Local disk I/O indicates how much onboard storage is being utilised and the throughput level achieved. Local disk space shows the percentage of total onboard storage in use. Lastly, memory monitoring tracks the percentage of total system memory in use and available.
Network Monitoring:
Network monitoring involves tracking three key performance elements: total bandwidth consumption, the number of transmitted packets, and the incidence of packet errors. By monitoring the total inbound and outbound bandwidth, you can identify potential bottlenecks or issues. Analysing the number of packets transmitted helps validate the bandwidth consumption and detect problems. Additionally, keeping an eye on packet errors is essential, as a high number of errors indicates network issues.
Storage Monitoring:
Storage monitoring focuses on shared storage devices and includes tracking array availability and performance, data volumes and their status, and array capacity usage. Since storage devices are shared and can impact multiple applications, their performance is critical. Monitoring data volumes and their status is important as arrays support multiple volumes tied to specific applications. Additionally, keeping an eye on the array capacity used and free space is fundamental to performance monitoring, as running out of storage space can affect application availability.
Software Monitoring:
While hardware monitoring is essential, software monitoring is equally crucial in today's complex application environments. It involves monitoring system software components that form the core infrastructure, such as hypervisors in virtualised environments. Preconfigured monitoring for common commercial applications like Microsoft Exchange and open-source applications is also necessary. Furthermore, a software development kit enables custom application monitoring and tracking of additional metrics like the number of calls per second to specific functions. The ability to monitor external services is vital to assess their availability and performance impact on applications.
Fixing TCP Port Monitor 1722 Not Found Error
You may want to see also


