pfSense is a powerful open-source firewall and routing platform based on FreeBSD. It is important to monitor the memory usage of your pfSense firewall to ensure optimal performance and to troubleshoot any issues. There are several ways to monitor memory usage in pfSense, including using the built-in graphs, navigating to the Diagnostics > System Activity page, and using third-party tools like Paessler PRTG Network Monitor and LogicMonitor. By regularly monitoring memory usage, you can identify high memory usage, ensure adequate RAM is available, and optimize your pfSense configuration for better performance.
| Characteristics | Values |
|---|---|
| System Activity | Displayed under Diagnostics > System Activity or Status > Monitoring |
| System Load Average | Can be viewed on the System Activity page |
| Process Count | Can be viewed on the System Activity page |
| CPU Usage | Can be viewed on the System Activity page or via graphs |
| Memory Usage Breakdown | Can be viewed on the System Activity page or via graphs |
| ZFS ARC Usage Breakdown | Can be viewed on the System Activity page |
| Active Processes | Can be viewed on the System Activity page |
| Memory Calculation | (Used Real kB) = memTotalReal - memAvailReal - memBuffer - memCached |
| SNMP Values | memTotalSwap, memAvailSwap, memTotalReal, memAvailReal, memTotalFree, memMinimumSwap, memShared, memBuffer, memCached |
What You'll Learn

Check System Activity
To check system activity, you can navigate to Diagnostics > System Activity, which is equivalent to running the command top -aSH at a shell prompt. This page displays several aspects of system activity, including the system load average, total count of processes in various states (running, sleeping, waiting, etc.), current CPU usage, and a breakdown of memory usage in various areas.
The output will also include a ZFS ARC usage breakdown if the system contains any active ZFS pools. Additionally, you can view a list of the active processes running on the firewall, which can help identify processes that consume the most CPU power during high load. For example, if the highest entry is an interrupt processing queue for a network card, it could indicate that the firewall is trying to push more than the hardware can handle in the current configuration.
Furthermore, to check for high memory usage, navigate to System > Advanced > Firewall & NAT and review the Firewall Maximum States and Firewall Maximum Table Entries fields. Each state table entry requires about 1 KB of RAM, and the default state table size is calculated as 10% of the available RAM in the firewall.
For large environments with state tables requiring several hundred thousand or million connections, ensure that adequate RAM is available. Additionally, some packages, such as Snort and ntop, significantly increase RAM requirements and should not be installed on systems with less than 1 GB of RAM.
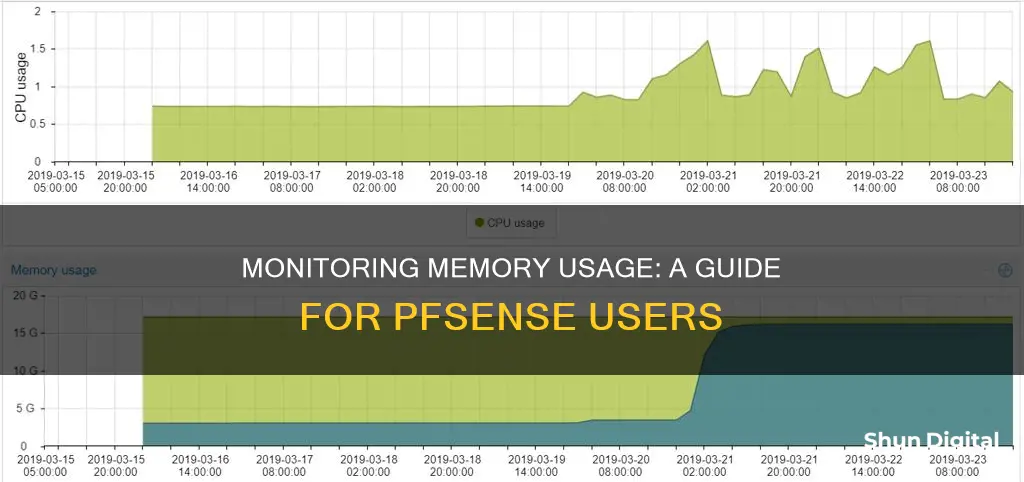
PfSense software also provides built-in graphs that monitor different aspects of the system, including CPU usage, memory usage, state table usage, throughput, link quality, and more. These graphs are available under Status > Monitoring and can be customised for easy comparison.
Monitoring Internet Usage: Strategies for Companies to Track Activity
You may want to see also

Navigate to Diagnostics
To monitor memory usage in pfSense, one of the steps you can take is to navigate to Diagnostics. This will provide you with an overview of your system's activity and performance.
The Diagnostics feature in pfSense offers valuable insights into various aspects of your system's health and activity. By accessing the Diagnostics area, you can view the System Activity page, which displays critical information about how your system is functioning. This includes details such as system load average, total counts of processes in different states (running, sleeping, waiting, etc.), current CPU usage, and, most importantly, a breakdown of memory usage.
The memory usage breakdown will provide a clear picture of how your system's memory is being utilised. It will show you which areas of your system are consuming memory resources, allowing you to identify any potential memory leaks or inefficient memory management. This information is updated every few seconds, providing you with real-time data to make informed decisions.
Additionally, the Diagnostics section may also offer graphs that visually represent memory usage alongside other metrics like CPU usage, state table usage, throughput, and link quality. These graphs, often found under Status > Monitoring, can be customised to compare different categories, making it easier to identify trends and potential issues.
By navigating to Diagnostics and exploring the System Activity page and associated graphs, you can effectively monitor memory usage in pfSense, ensuring optimal performance and resource allocation for your system.
Monitoring Internet Usage on iPads: A Comprehensive Guide
You may want to see also

Monitor with Paessler
Paessler offers a range of tools to monitor memory usage in pfSense. With over 500,000 daily users, Paessler PRTG is a popular choice for network monitoring.
The Paessler Knowledge Base suggests that monitoring pfSense CPU and memory is possible with SNMP. The support team recommends trying the SNMP Library Sensors with the "Paessler Common OID Library". If this does not work, they suggest trying the OIDs listed on http://glr81.free.fr/pages/pfsense-snmp-oid.htm.
For those who want to display the live network usage that goes through their PFSense firewall, the Paessler Knowledge Base also provides an answer. The recommendation is to use SNMP Traffic Sensors, which monitor the traffic in a Delta. This means that no data is lost when scanning an interface every few seconds or minutes as the sensors always request the counter, not the current speed.
The Paessler Knowledge Base also includes a formula to calculate the "Used Real kB" value for pfSense boxes being monitored over SNMP. This formula is: Used "Real" kB value = memTotalReal - memAvailReal - memBuffer - memCached.
It is important to note that the information in the Paessler Knowledge Base comes without any warranty, and users are advised to use it at their own risk.
Monitoring App Usage: Regulating Screen Time and Freedom
You may want to see also

SNMP monitoring
The Simple Network Management Protocol (SNMP) daemon enables the remote monitoring of pfSense software parameters. The SNMP daemon supports monitoring network traffic, network flows, pf queues, and general system information such as CPU, memory, and disk usage.
The SNMP implementation is bsnmpd, which by default only has the most basic management information bases (MIBs) available, and is extended by loadable modules. The SNMP service can be configured by navigating to Services > SNMP in the pfSense web interface.
To enable SNMP, check "Enable the SNMP Daemon and its controls". Ensure the polling port is 161 and enter the community string you would like to use. It is best practice to use a different value than the default "public" for the community string, and to restrict access to the SNMP service with firewall rules.
SNMP connections are made using UDP port 161, and SNMP clients default to using this port when listening for client queries. The SNMP daemon can be configured to listen for queries on IPv4, IPv6, or both.
The SNMP daemon can also send traps to an SNMP server for certain events, such as network link state changes when the MIB II module is loaded. When set, the SNMP daemon will generate SNMP traps and display options to control SNMP trap behaviour.
Monitoring Internet Usage: BigPond's Guide to Online Activity
You may want to see also

Using built-in graphs
PfSense software has many built-in graphs that monitor different aspects of the system, and they work without any intervention. The firewall collects and maintains data about how the system performs and stores this data in Round-Robin Database (RRD) files.
The built-in graphs are available under Status > Monitoring. They measure things like CPU usage, memory usage, state table usage, throughput (in bytes and packets), link quality, and traffic shaping queue usage. The graphs can be configured to show items from several categories, and a category and graph may be chosen for both the left and right axes for easy comparison.
The Diagnostics > System Activity page displays several aspects of system activity as reported by top and is updated every few seconds. This includes a breakdown of memory usage in various areas.
The output contains several key types of information, including the system load average, a total count of processes in various states (e.g. running, sleeping, waiting), the current CPU usage, and a breakdown of memory usage in various areas.
The memory graphs (Memory Graph) show the different memory pools in FreeBSD, which include active (in use) memory pages referenced by userland (non-kernel), memory pages that are considered inactive, memory available for immediate use, and memory used by the operating system for caching.
Monitoring Raspberry Pi: CPU Temp and RAM Usage
You may want to see also
Frequently asked questions
You can monitor memory usage in PFSense by navigating to Diagnostics > System Activity. This will display a breakdown of memory usage in various areas.
The data on the System Activity page is updated every few seconds.
You can also use built-in graphs to monitor memory usage. These graphs are available under Status > Monitoring and can be customised to display specific categories and comparisons.
Navigate to System → Advanced → Firewall & NAT and check the Firewall Maximum States and Firewall Maximum Table Entries fields. Each state table entry requires about 1 KB of RAM, so ensure that you have adequate RAM available for your setup.


