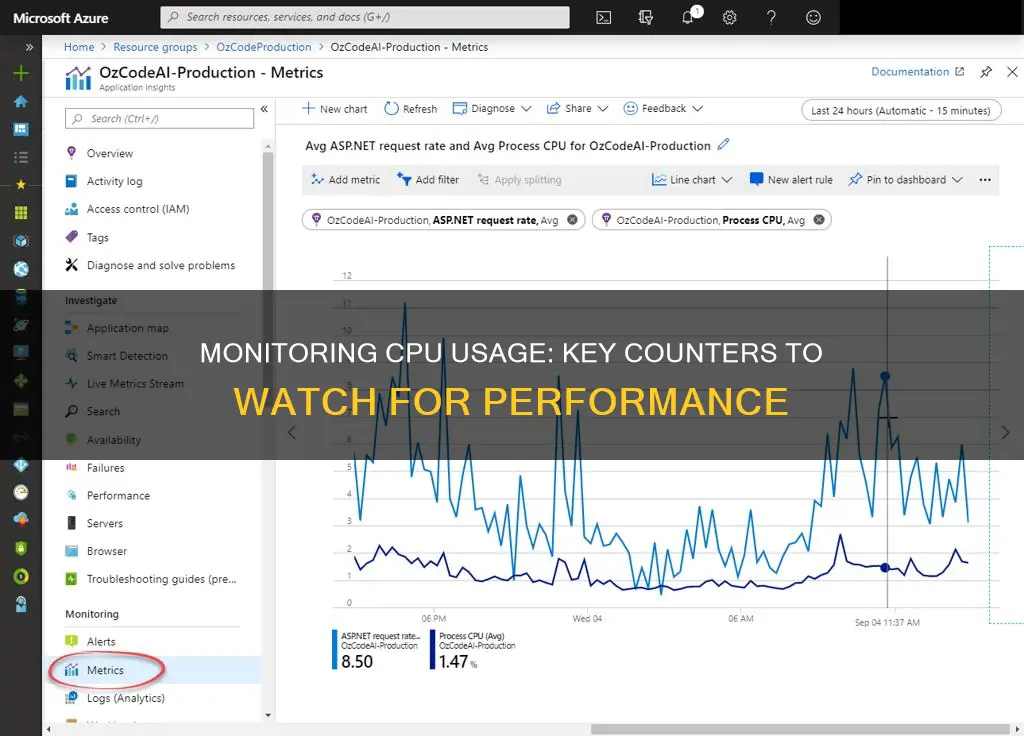
Monitoring CPU usage is a crucial aspect of maintaining optimal system performance. While there are various tools available, such as Windows Task Manager and Intel® Performance Counter Monitor, one popular method is utilising performance counters. These counters provide insights into specific metrics, such as % Processor Time, % User Time, % Privilege Time, and % Interrupt Time. By tracking these counters, administrators can identify bottlenecks, optimise query plans, and make informed decisions about upgrading hardware. For instance, a sustained value of two or more threads in the Processor Queue Length counter indicates a processor bottleneck. Additionally, monitoring % Processor Time is essential for multiprocessor systems to ensure balanced performance. With the right tools and counters, administrators can effectively manage CPU usage and enhance overall system efficiency.
| Characteristics | Values |
|---|---|
| Processor: % Processor Time | Displays the percentage of time the CPU spends executing a thread that is not idle |
| Processor: % User Time | Displays the percentage of time a process spends executing user processes |
| Processor: % Privilege Time | Displays the percentage of time the processor spends executing Microsoft Windows kernel commands |
| Processor: % Interrupt Time | Displays the time a processor spends receiving and servicing hardware interruptions during specific sample intervals |
| System: Processor Queue Length | Displays the number of threads waiting to be processed by any CPU |
| System: Calls/sec | Displays the number of software calls to the operating system service routines per second |
| Context Switches/sec | Displays the number of times a processor switches from one thread to another |
What You'll Learn

Processor: % Processor Time
A high rate of CPU usage, in the range of 80% to 90%, could indicate a problem. If you have a multiprocessor system, monitor each % Processor Time counter for each processor. If you have a SQL server that can manage multiple calculations simultaneously, 100% of the processor's time can be used without causing a bottleneck. However, monitor this closely to ensure that the performance of other applications does not suffer.
If you notice a consistently high rate of CPU usage in the 80% to 90% range, you may need to upgrade your CPU. Install a faster processor or add more processors if you have a multiprocessor system.
To set up this performance counter, open the Control Panel and click on Administrative Tools. Next, click on the Performance option and right-click on Counter Logs. After that, select New Log Settings and enter a name for the log, then click OK. Now, click on Add Objects and select the type of performance object you want. Finally, click Add and Close, and change the Log File type to "Text File (Tab Delimited)".
To add this counter in Perfmon, click on the '+' icon to add counters. Find and expand the process group, then select '% Processor Time' and select all instances in the instance box.
Monitoring Home Electricity Usage: A UK Guide
You may want to see also

Processor: % User Time
To set up a performance counter for CPU usage, go to the Control Panel and click on Administrative Tools. Click on the Performance option and right-click on Counter Logs. Select the New Log Settings and enter a name for the log, then click OK. Click on Add Objects and select the type of performance object you want. Click Add and Close, then change the Log File type to "Text File (Tab Delimited)" and click Apply and OK.
To monitor CPU usage per process, add a counter for Process > % Processor Time and select all instances.
Monitoring Children's Internet Usage: Parenting or Invasion?
You may want to see also

Processor: % Privilege Time
% Privilege Time is useful for identifying disk I/O bottlenecks. If this counter shows high usage, it is recommended to monitor DISK IO-related performance counters to pinpoint the issue. If possible, installing a faster or more efficient disk subsystem can help alleviate the bottleneck.
% Privilege Time is distinct from other counters such as % Processor Time, which displays the percentage of time the CPU spends executing non-idle threads. While related, it is important to monitor both to gain a comprehensive understanding of CPU usage and identify any potential bottlenecks.
Additionally, % Privilege Time differs from % User Time, which represents the percentage of time spent on user processes like SQL Server. Monitoring these counters together can help determine whether high CPU usage is due to user applications or other factors.
Monitor Broadband Usage: A Guide for BSNL Users
You may want to see also

Processor: % Interrupt Time
% Interrupt Time is related to % DPC Time, which is another Perfmon counter. This counter measures the time spent in "DPC routines", or code serialized with them, which runs at IRQL 2. DPCs are used to handle work that is triggered by an interrupt but does not need to be done in the same serialization context as the ISR.
The discrepancy between total processor time and the total of the processes' CPU time is likely due to time spent at elevated IRQL. This includes % Interrupt Time and % DPC Time. Such code runs at IRQL 3 and above, and is not associated with the current thread's activities, so it is not included in the CPU time for any thread or process.
Unlocking GPU Usage Monitoring: A Unified Approach
You may want to see also

System: Processor Queue Length
The System: Processor Queue Length counter provides information on the number of threads waiting to be processed by any CPU. This is in contrast to the Server Work Queue Length, which measures the number of threads waiting to be processed by a particular CPU.
A processor bottleneck occurs when threads require more processor time than is available. This can be identified by a high rate of CPU usage, typically in the range of 80% to 90%. However, it is important to note that if you have a SQL server that executes numerous calculations, 100% of the processor's time can be utilised without causing a bottleneck.
The System: Processor Queue Length counter specifically indicates a CPU bottleneck when its value is greater than zero. This means that there are multiple threads waiting for processor time.
To avoid processor bottlenecks, it is recommended to monitor the System: Processor Queue Length counter alongside the Processor: % Processor Time counter. If the System: Processor Queue Length counter has a sustained value greater than zero, and the Processor: % Processor Time counter is also high, then you may need to upgrade your CPU or add additional processors if you have a multiprocessor system.
Hilton's Internet Monitoring: What You Need to Know
You may want to see also


