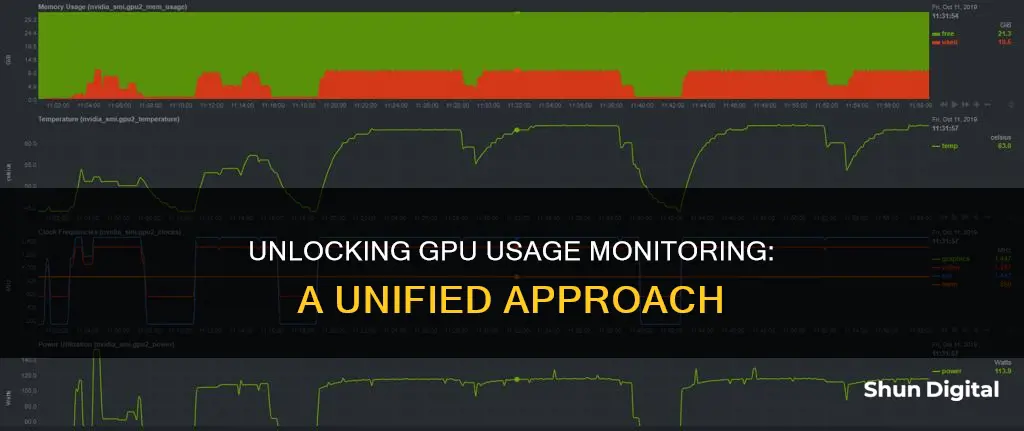
If you're experiencing issues with your GPU usage jumping back and forth from 0% to 100%, you may need to enable unified GPU usage monitoring. This issue has been commonly observed with AMD GPUs, where the GPU usage readings fluctuate between 0% and 100%. To resolve this, you can enable the Unified GPU Usage Monitoring option in the settings of GPU monitoring software such as MSI Afterburner or HWiNFO. This option ensures that the GPU usage data is sourced from the D3D Driver, providing more consistent and accurate readings. It's important to note that this issue may also be related to outdated Windows builds or AMD drivers, so ensuring your system is up to date is recommended.
| Characteristics | Values |
|---|---|
| Software | MSI Afterburner |
| Fix for | GPU usage jumping back and forth from 0% to 100% |
| Where to find it | In the general tab in settings |
What You'll Learn

GPU usage jumping from 0% to 100%
If you are using MSI Afterburner and your GPU usage is jumping from 0% to 100%, you can resolve this issue by enabling "Unified GPU Usage Monitoring" in the general tab in settings. This issue is caused by an odd bug that affects some AMD GPUs, and enabling the aforementioned setting will provide a more consistent reading of your GPU usage.
It is important to note that this issue does not affect performance, and simply results in an inaccurate display of GPU usage. By enabling "Unified GPU Usage Monitoring", you will be able to see a more accurate representation of your GPU usage, which may fluctuate but should not jump between 0% and 100%.
Additionally, if you are using the HWiNFO app to monitor your GPU usage, you may experience similar issues with the GPU Utilization percentage spiking from 0% to 100%. In this case, switching to MSI Afterburner and enabling the "Unified GPU monitoring" option can provide a more accurate reading of your GPU usage.
It is worth mentioning that the "Unified GPU monitoring" option in MSI Afterburner uses the same method as the "GPU D3D Usage" value in HWiNFO, which has been found to provide more accurate results for AMD GPUs.
Verizon's Home Internet Monitoring: What You Need to Know
You may want to see also

MSI Afterburner fix
If you are using an AMD GPU, you may encounter an issue where the GPU usage is jumping back and forth from 0% to 100%. This can be fixed by enabling "Unified GPU Usage Monitoring" in the general tab in the settings of MSI Afterburner. This issue is caused by AMD's driver not reporting the usage properly.
To fix this issue, follow these steps:
- Open MSI Afterburner.
- Navigate to the "Settings" menu.
- Go to the General tab.
- Find the Enable unified GPU usage monitoring option and make sure it is checked.
- Save the changes and restart your computer.
Additionally, if you are experiencing GPU usage spikes when opening MSI Afterburner, it is recommended to keep the program running in the background instead of closing and reopening it repeatedly. You can set MSI Afterburner to Start with Windows in the Settings menu to have it automatically load your settings and GPU fan settings upon computer startup.
If you are still encountering issues with GPU usage spikes, it may be helpful to download and install RivaTuner Statistics Server, as this software is required to display hardware monitoring data while gaming.
Collab Edit: Browser Usage Monitored for User Experience
You may want to see also

GPU utilisation % spikes
If you are using MSI Afterburner and your GPU usage is jumping back and forth from 0% to 100%, you can resolve this issue by enabling "Unified GPU Usage Monitoring" in the general tab in the settings. This is a known bug, and enabling the aforementioned setting will make the GPU report its usage more like Nvidia cards do.
If you are experiencing GPU utilisation spikes, there are several potential causes:
- Background processes and applications: Background applications or processes can unexpectedly demand GPU resources. This could include software like web browsers with hardware acceleration enabled, video players, or even background updates. Use Task Manager (Windows) or Activity Monitor (macOS) to monitor which applications are using the GPU, and close any unnecessary programs or disable hardware acceleration in non-essential applications.
- Outdated or corrupt drivers: Outdated or corrupt GPU drivers can cause erratic behaviour, including random spikes in utilisation. Ensure your GPU drivers are up-to-date by checking the manufacturer’s website or using driver management software. If issues persist after a driver update, consider rolling back to a previous version or performing a clean install of the drivers.
- Malware or unwanted software: Malware or unwanted software can hijack your GPU’s resources for malicious activities like cryptocurrency mining, leading to unexplained spikes in GPU usage. Run a thorough malware scan using reputable antivirus software, remove any detected threats, and ensure your system is protected against future infections.
- Power management settings: Improper power management settings can cause the GPU to ramp up its performance unnecessarily, leading to spikes in utilisation. Adjust your power management settings to favour performance over power saving. On Windows, this can be done by selecting the ‘High Performance’ power plan and ensuring your GPU’s power management mode is set to ‘Prefer Maximum Performance’ in the NVIDIA Control Panel or the equivalent setting for your GPU.
- Temperature throttling: If your GPU is overheating, it may throttle its performance to reduce temperature, causing the GPU to alternate between high and low usage, resulting in spikes. Ensure your system has adequate cooling and consider upgrading your cooling solution if necessary.
- Graphics settings in games or applications: High or inappropriate graphics settings can cause sudden demands on the GPU, especially in graphically intensive scenes, resulting in utilisation spikes. Lower the graphics settings in your games or applications to reduce the load on the GPU, and consider turning off features like anti-aliasing, shadows, and texture filtering if they are not essential.
If you are still experiencing GPU utilisation spikes, you may need to consult with a professional or consider a hardware upgrade.
OpenLM's Actual Usage Time: Monitoring and Management Strategies
You may want to see also

High and low GPU usage
High CPU Usage but Low GPU Usage
This issue commonly occurs during gameplay. For example, it may happen when playing games like Overwatch, Battlefield 5, or PUBG. Here are some ways to address this issue:
- Disable all power-preserving modes.
- Close tasks running in the background.
- Update the graphics driver.
- Enable XMP in BIOS/UEFI.
- Lower in-game settings.
- Reinstall the faulty game.
Low GPU Usage
Low GPU usage can be caused by several factors, including:
- CPU bottleneck: The CPU cannot supply data to the GPU fast enough, causing the GPU to idle.
- Memory bottleneck: The GPU spends a lot of time waiting for data to be transferred to or from memory.
- Inefficient parallelization: The application is not properly parallelized, or the workload cannot be evenly distributed across all the GPU cores.
- Low compute intensity: The task may not be very computationally intensive, and may not fully utilize the GPU's processing power.
- Use of single precision vs. double precision: The GPU may have different performance characteristics for single-precision and double-precision calculations.
- Synchronization and blocking operations: Certain operations can block the GPU and cause it to idle, including explicit synchronization, memory allocation, and certain types of memory transfer.
- Reinstall the graphics driver.
- Disable third-party background apps.
- Install patches and optimize game settings.
- Update chipset drivers.
- Change in-game settings.
- Avoid CPU overheating.
- Decrease the clock rate.
- Reinstall the game.
- Disable all power-preserving modes.
- Reinstall Windows.
Monitoring Children's Internet Usage: Parenting in the Digital Age
You may want to see also

GPU usage monitoring equivalent
There are several GPU usage monitoring tools available for different types of GPUs.
For Nvidia GPUs, the most familiar GPU monitoring tool is the command-line utility tool nvidia-smi (NVIDIA System Management Interface). This is usually installed during the NVIDIA driver installation, though it is a separate package. To use it, simply type "nvidia-smi" at the terminal prompt. To get a repeated display of GPU information for a given time interval, use the -l option. For example, "nvidia-smi -l 5" will provide an update every 5 seconds.
For a more concise, prettier, and simpler alternative to nvidia-smi, you can use a Python library called gpustat. To install it, type "pip install --user gpustat" in the terminal. Then, simply type "gpustat" to get a concise, readable summary of your current GPU status.
If you prefer a visual overview of what's going on, you can use nvtop, which provides real-time graphs of key information from the GPUs. To install it, type "sudo apt install nvtop" in the terminal.
For Intel GPUs, you can use intel-gpu-tools. First, install it with "sudo apt-get install intel-gpu-tools", then start it with "sudo intel_gpu_top".
For AMD GPUs, you can use MSI Afterburner and enable "Unified GPU Usage Monitoring" in the general settings. This will make the GPU report usage more like Nvidia cards do.
There are also other GPU monitoring tools available, such as RadeonTop for Radeon GPUs, and jupyterlab-nvdashboard, a plugin for Jupyter Lab.
Internet Monitoring: How Often Are We Tracked Online?
You may want to see also
Frequently asked questions
Unified GPU Usage Monitoring is an option in MSI Afterburner that prevents GPU Usage from jumping between 0% and 100%.
To enable Unified GPU Usage Monitoring, go to the general tab in the settings of MSI Afterburner and check the box at the bottom of the page.
GPU usage spiking is a common issue that can be caused by a variety of factors, including the type of GPU, the drivers being used, and the operating system. Enabling Unified GPU Usage Monitoring can help to prevent this issue.


