ReadyBoost is a feature in Windows that can improve disk performance and speed up your system. However, its impact can be hard to discern, and users may wonder if it's making a difference. To find out, you can monitor its performance using two built-in Windows applications: Resource Monitor and Performance Monitor. These tools provide detailed insights into how ReadyBoost is affecting your system, allowing you to assess its effectiveness. With their help, you can cut through the complexity of system optimisation and make informed decisions about your computer setup.
| Characteristics | Values |
|---|---|
| Operating System | Windows 10, Windows 8, Windows 7, Windows Vista |
| Tools | Resource Monitor, Performance Monitor |
| Performance Monitor Access | Press "Windows-Q," enter "Perfmon" into the Search field, and then press "Enter" |
| Performance Monitor Steps | Click the "Monitoring Tools" side tab, and then select "Performance Monitor." Click the red "Delete" button, then click the green "Add" button. Expand the "ReadyBoost Cache" counter, click "Bytes Cached," then click "Add." Select "Bytes Cached" under the Added Counter section, and then click "OK" |
| Resource Monitor Access | Press [Windows]+R, type Resmon.exe in the Open text box, and press [Enter] |
| Resource Monitor Steps | Select the Disk tab. Select the System check box in the Processes With Disk Activity panel to enable the Filtering feature. Move down to the Disk Activity panel to locate and select the ReadyBoost.sfcache file on your USB flash drive. Launch an application that will perform a lot of disk activity, reading and writing data to and from the hard disk |
What You'll Learn

Using Resource Monitor
To monitor ReadyBoost performance using the Resource Monitor, follow these steps:
First, open the Resource Monitor by pressing the Windows key and R simultaneously on your keyboard, then type 'Resmon.exe' in the Open text box and press Enter.
In the Resource Monitor user interface, select the Disk tab. Then, enable the Filtering feature by selecting the System checkbox in the 'Processes With Disk Activity' panel. This will allow you to highlight specific processes or services. When a process is selected, the Filtering feature ensures that only the selected process is displayed, making it easier to understand where and how it is being used.
Now, move to the Disk Activity panel, where you will see files running under the System. This will make it easy to locate and select the 'ReadyBoost.sfcache' file on your USB flash drive.
At this stage, launch an application that will perform a significant amount of disk activity, such as reading and writing data to and from the hard disk. For instance, you can launch a web browser like Microsoft Edge.
With the application running, you will observe that the 'ReadyBoost.sfcache' file is indicating that ReadyBoost is reading and writing a significant amount of data to and from its cache. Additionally, you will notice spikes and dips in the graph for your USB flash drive, representing fluctuations in its activity.
If you close the application, you will see the amount of data handled by ReadyBoost decrease, and it may even disappear from the Disk Activity panel. However, relaunching the application will result in a resurgence of ReadyBoost activity.
The Resource Monitor provides a detailed view of ReadyBoost in action, allowing you to assess its impact on your system's performance.
Monitoring NVIDIA GPU Memory Usage: A Comprehensive Guide
You may want to see also

Using Performance Monitor
To monitor ReadyBoost performance using Performance Monitor, you can follow these steps:
Firstly, open the Windows Run Commander by pressing "Windows + R" on your keyboard. This will bring up the Run box. Then, type "perfmon" into the box and hit enter. This will launch the Performance Monitor, a powerful tool that provides in-depth insights into your system's performance.
Once the Performance Monitor is open, navigate to the "Monitoring Tools" section in the left-hand pane. Here, you'll find various analytical tools, including the "Performance Monitor" option. Double-click on it to launch it.
With the Performance Monitor window open, you'll see a prominent "[X] button" at the top. Click on this button to customise your performance monitoring settings. To add specific metrics for monitoring, locate and click on the green "+" button.
In the menu that appears, scroll down the left-hand menu until you find the "ReadyBoost Cache" counter. Click to expand this option, as this is where you'll find the relevant metrics specifically related to ReadyBoost.
From the expanded options, select "Bytes Cached." This will allow you to monitor the amount of data being cached by ReadyBoost. Click "Add" to include this metric in your performance analysis.
Now, click "OK" to finalise your selections. You will then be presented with a real-time graphical representation of your ReadyBoost cache's performance. If you wish to add more metrics for a comprehensive analysis, simply repeat the above steps to include additional counters.
When you're done monitoring and want to exit the Performance Monitor, simply press "Alt + F4" on your keyboard. This will close the window and save your settings for future use.
Best Places to Buy Print Editions of the Christian Science Monitor
You may want to see also

Creating a Data Collector Set
If you want to log ReadyBoost activity over a period of time, you will need to create a Data Collector Set. Here is a step-by-step guide on how to do this:
- Start by changing the Graph Type to Line.
- Next, expand the Data Collector Sets branch in the Performance Monitor navigation pane.
- Then, right-click on "User Defined", select "New", and click on "Data Collector Set".
- When the Create New Data Collector Set wizard appears, enter a name for the set and select the "Create Manually" option, then click "Next".
- Now select the "Performance Counter" check box and click "Next".
- On the next page, use the "Add" button to access the "Add Counters" dialog box, where you can individually select the four pertinent counters.
- You will then work through the next two steps in the wizard to add the pertinent counters to your ReadyBoost Monitor Data Collector Set.
- Click "Finish" to complete the wizard.
- When you return to the Performance Monitor window, you will see your ReadyBoost Monitor Data Collector Set.
- When you are ready to begin logging ReadyBoost activity, click the green "Play" icon.
Once you have used your system for a substantial amount of time, you can open your Data Collector Set and view the log. To do so, click the "Stop" icon and then select "Performance Monitor" in the navigation pane. Click the "View Log Data" icon to open the Performance Monitor Properties dialog box. Click the "Add" button, and you can locate and select your log file.
Is Your Webcam Spying? How to Know for Sure
You may want to see also

Checking if ReadyBoost is active
To check if ReadyBoost is active, you can use the built-in application Performance Monitor. This application allows you to view performance data or counters in real time and from log files.
- Press "Windows-Q" and enter "Perfmon" into the search field. Press "Enter" to open the Performance Monitor.
- Click on the "Monitoring Tools" side tab and select "Performance Monitor".
- Click the red "Delete" or "X" button on the menu bar, and then click the green "Add" or "+" button.
- Scroll down the "Available Counters" section and expand the "ReadyBoost Cache" counter.
- Click on "Bytes Cached" and then click the "Add" button.
- Select "Bytes Cached" under the "Added Counter" section and click "OK".
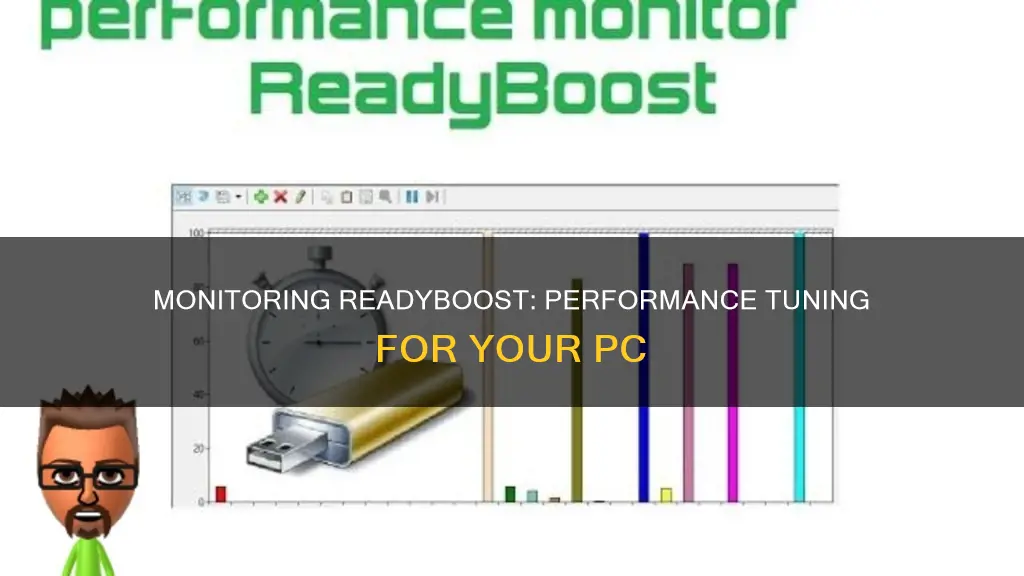
- You will see a graph of the ReadyBoost cache within the Performance Monitor window. If there is any activity on the graph besides the vertical red line, ReadyBoost is active.
If you do not see any activity on the Performance Monitor, you can open several memory-intensive applications to test if your system starts to use ReadyBoost.
Another way to investigate ReadyBoost's performance is by using the Resource Monitor. This tool allows you to filter and highlight certain processes or services, making it easy to see where and how they are coming into play.
Asus Monitor: Website Ordering Worth It?
You may want to see also

Viewing ReadyBoost cache usage
To view the ReadyBoost cache usage, you can use the Windows Performance Monitor. This tool allows you to monitor the performance of your favourite programs and processes in real time or through logged data. It offers unmatched versatility and provides an in-depth view of your system's performance.
Here's a step-by-step guide to using the Performance Monitor to view the ReadyBoost cache usage:
- Open the Windows Run Commander by pressing "Windows + R" on your keyboard.
- In the Run Commander, type "perfmon" and press Enter. This will launch the Performance Monitor.
- In the navigation pane on the left, locate and click on "Monitoring Tools".
- From the options that appear, select "Performance Monitor".
- In the Performance Monitor window, click on the red "Delete" or "X" button to remove the default counter (Processor Time).
- Next, click on the green "+" or "Add" button to add a new counter.
- In the "Add Counters" dialog box, locate and expand the "ReadyBoost Cache" counter by clicking on the arrow button next to it.
- From the expanded options, select "Bytes Cached" and click "Add".
- Click "OK" to confirm your selection.
- You will now see a graph displaying the ReadyBoost cache usage within the Performance Monitor window. If the graph shows any activity besides the vertical red line, it indicates that ReadyBoost is active.
By following these steps, you can effectively monitor the ReadyBoost cache usage and gain insights into its impact on your system's performance.
Additionally, you can also use the Resource Monitor to investigate ReadyBoost's performance. The Resource Monitor provides a detailed view of disk activity and allows you to filter processes to see where and how they are impacting system performance. It offers a good view of ReadyBoost in action, showing the data being read from and written to its cache.
To use the Resource Monitor, press "Windows]+R", type "Resmon.exe" in the Open text box, and press Enter. Select the "Disk" tab, and enable the "System" checkbox in the "Processes With Disk Activity" panel to filter the processes. You can then launch applications that perform a lot of disk activity to observe the impact on the ReadyBoost.sfcache file.
Asus Monitors: LED vs OLED Technology Explained
You may want to see also
Frequently asked questions
Press the "Windows" and "R" keys together, type "perfmon.exe" into the Open text box, and press "Enter".
Click the green "Add" button, scroll down the Available Counters section, expand the "ReadyBoost Cache" counter, click "Bytes Cached", and then click "Add" again.
If you see any activity on the graph besides the vertical red line, ReadyBoost is currently active.


