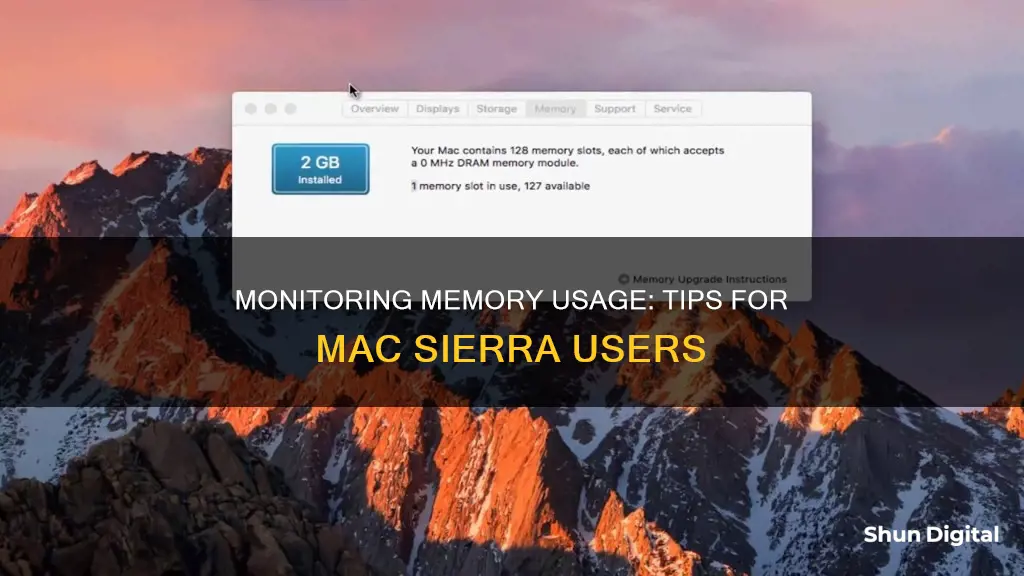
Monitoring memory usage is important to ensure that your Mac is running efficiently. When your Mac runs out of RAM, it starts to push sections in RAM to your storage, slowing down operations. To check memory usage, you can use the Activity Monitor app, which can be found in the Utilities folder inside the Applications folder. In the Activity Monitor, click on the Memory tab to see a list of processes run by various apps and how much RAM they're using. The Memory Pressure graph will indicate whether your Mac is running efficiently (green), is stressed (yellow), or doesn't have enough RAM (red). You can also use third-party apps like iStat Menus, CleanMyMac, and App Tamer to monitor and manage memory usage.
| Characteristics | Values |
|---|---|
| How to monitor memory usage | Open Activity Monitor app |
| Where to find Activity Monitor | Applications > Utilities > Activity Monitor |
| Alternative way to open Activity Monitor | Click Command-Space and start typing Activity Monitor in the search bar |
| What to do if Activity Monitor is green | No action needed |
| What to do if Activity Monitor is yellow | Start quitting some applications |
| What to do if Activity Monitor is red | Buy more RAM or upgrade your system |
| Third-party utilities | iStat Menus, Sensei Monitor, Stats, iPulse, CleanMyMac |
What You'll Learn

Using Activity Monitor
To monitor memory usage on macOS Sierra, you can use the Activity Monitor. Here's a detailed guide on using Activity Monitor to check memory usage:
Opening Activity Monitor
To open Activity Monitor, go to Applications and type "Activity Monitor" in the search bar. Alternatively, you can use the shortcut by clicking Command-Space and then typing "Activity Monitor" in the search bar.
Understanding Memory Usage
Once you have Activity Monitor open, click on the "Memory" tab. Here's what each section in the Memory tab represents:
- Memory Pressure: This is a graphical representation of how efficiently your memory is serving your processing needs. The Memory Pressure graph ranges from green (little pressure) to yellow (significant pressure) to red (high pressure, indicating a lack of RAM space). It's important to check this graph regularly to ensure your Mac is not under memory pressure.
- Physical Memory: This shows the amount of RAM installed on your Mac.
- Memory Used: This indicates the amount of RAM currently being used. You can see where the memory is allocated to the right of this section.
- App Memory: This displays the amount of memory being used by individual apps.
- Wired Memory: This is the memory required by the system to operate and cannot be cached. It must stay in RAM and is not available to other apps.
- Compressed: This section shows the amount of memory that has been compressed to make more RAM available. When your Mac approaches its maximum memory capacity, inactive apps are compressed to free up memory for active apps.
- Cached Files: This represents the size of files cached by the system into unused memory to improve performance. These cached files remain until they are overwritten.
- Swap Used: This shows the amount of space being used on your startup disk to swap unused files to and from RAM.
Customizing the View
You can customize the columns displayed in the Activity Monitor by going to View > Columns and then choosing the columns you want to show. This allows you to monitor specific memory-related metrics that are important to you.
By using Activity Monitor, you can keep a close eye on your Mac's memory usage and make informed decisions about optimizing your system's performance.
Monitoring Java Heap Usage: Tips for Performance Optimization
You may want to see also

Checking CPU usage
There are several ways to check your CPU usage on macOS.
Firstly, you can use the Activity Monitor app. This is a built-in app that gives you an overview of what's using your central processor. To access it, go to Finder > Applications > Utilities > Activity Monitor > CPU. You can also view it from the menu bar by going to Applications > Utilities > Activity Monitor > View > Dock Icon > Show CPU Usage.
The Activity Monitor will show you a list of processes and activities running on your Mac in real time, with the most resource-intensive processes listed at the top. The graph displayed at the bottom shows a breakdown of your CPU usage and consumption. However, some users may find this method confusing, as the list of processes may be unclear to those unfamiliar with macOS.
Another way to check CPU usage is by using a third-party app such as CleanMyMac X, iStat Menus, App Tamer, Usage, or Novabench. These apps offer more comprehensive performance tracking and allow you to set limits, benchmark your performance, and track real-time metrics. For example, CleanMyMac X has a free CPU monitoring feature that gives you an instant, real-time overview and indicates any heavy CPU programs or apps. iStat Menus collects system data such as temperature, battery life, disk activity, and CPU load, and you can customize your menu bar view to show as much or as little information as you want. App Tamer allows you to view and control CPU usage by setting usage limits or pausing applications. The Usage app lets you create widgets to easily keep track of CPU usage, battery health, disk space, and more. Finally, Novabench runs tests to measure your computer's CPU, GPU, RAM, and disk speed, providing easy-to-read graphs to help interpret the results.
You can also check your CPU usage using Terminal by going to Applications > Utilities > Terminal, and then pasting a specific command.
Monitoring FPS, CPU, GPU, and RAM: A Comprehensive Guide
You may want to see also

Clearing cache files
Cache files are a type of temporary storage that allows your Mac to quickly and efficiently access data. While caches are designed to improve performance, they can become clogged with old files over time, so it's a good idea to clear them out regularly. There are three main types of caches on your Mac: the system cache, the browser cache, and the user cache (including app cache).
Clear System Cache:
- Open Finder and select 'Go to Folder' from the Go menu.
- Paste `/Library/Caches` and press Return.
- Browse through the `com.apple` folders and send files to the Trash. Note: Only delete files and preserve the folders.
Clear Browser Cache:
- Safari: Open Safari and go to Preferences/Settings > Advanced > Develop > Empty Caches. Alternatively, use the keyboard shortcut Command + Option + E.
- Chrome: Open Chrome and go to Settings (three dots in the top right) > Privacy and Security > Clear Browsing Data. Select 'Cached images and files' and set the time range to 'All time'. Then click 'Clear Data'. Alternatively, use the keyboard shortcut Command + Shift + Delete.
- Firefox: Open Firefox and go to about:preferences > Privacy & Security > Cookies and Site Data > Clear Data. Select 'Cached Web Content' and click 'Clear'. Alternatively, use the keyboard shortcut Command + Shift + Delete.
Clear User Cache:
- Open Finder and select 'Go to Folder' from the Go menu.
- Type `~/Library/Caches` and press Return.
- Go through each folder and delete the files inside. Note: Only delete the files and not the folders themselves.
- Empty the Trash when you're done.
Additionally, you can use third-party apps like CleanMyMac to automate the cache-clearing process and make it even easier.
University WiFi: Staff Privacy and Monitoring Concerns
You may want to see also

Reducing the number of open apps
To reduce the number of open apps on your Mac, you can do the following:
Remove Login Items
Login Items are programs that automatically load upon startup. To free up RAM, you can remove these login items. You can do this by going to System Settings > General > Login Items. Here, you will see a list of apps set to launch on startup. You can remove any item by highlighting it and clicking the minus button. Alternatively, you can also do this from the Dock. Control-click on the app, hover over Options, and uncheck Open at Login.
Remove Launch Daemons and Agents
Launch Daemons and Agents are hidden within your libraries and can be found in the following locations:
- Open your disk drive in Finder, then open Library and look for folders named LaunchAgents and LaunchDaemons.
- Open Finder, click Go, and hold down the Option key. Select the Library folder, then open the LaunchAgents folder.
Within these folders are .plist files that may be connected to certain programs or services. If you see a file name that matches a program that continues to launch on startup, you can delete it.
Delay Startup Apps
If you want to keep your startup apps but want to avoid having them all open at once, you can use programs like Delay Start and DelayedLauncher to set a timer for specific apps. This lets you control when they start up.
Close Finder Windows
Each window in the Finder eats up RAM. To free up memory, you can merge all your windows into one by going to Finder > Window > Merge All Windows.
Keep Fewer Browser Tabs Open
Regardless of the browser you use, having too many tabs open can eat up memory. Close any unnecessary tabs or save them to your reading list or bookmarks if you need to access them later.
Monitoring Internet Usage: Free LAN Solutions
You may want to see also

Restarting your Mac
To restart your Mac, simply click on the Apple logo in the top-left corner of your screen and select "Restart" from the drop-down menu. Your Mac will then shut down and start back up again.
If you are unable to restart your Mac, you can try other methods to free up memory. One option is to use an app to clear your Mac's RAM, such as CleanMyMac, which can be downloaded for free. This app will help you declutter, optimise, and protect your Mac. You can also try to free up disk space by deleting large unused files, rarely used applications, and old downloads. It is recommended to keep at least 20% of your drive space free.
Additionally, you can try to remove login items that load automatically upon startup. To do this, go to System Settings > General > Login Items. From there, you can select and remove any programs you don't want to load during startup.
By following these steps, you can effectively free up memory on your Mac and improve its performance.
Monitoring Electrical Usage: Circuit Surveillance Simplified
You may want to see also
Frequently asked questions
You can monitor memory usage on macOS by using the Activity Monitor app.
The Activity Monitor app shows a list of processes run by various apps and how much RAM they are using.
You can find the Activity Monitor in the Utilities folder inside the Applications folder.
The Memory Pressure graph shows relative memory usage over time. If the graph is green, your memory usage is good. If it's yellow, your Mac is stressed and you may need to quit some apps. If it's red, you need more RAM.
To reduce memory usage, you can quit apps that are using a lot of memory, remove login items, restart your Mac, free up disk space, or use a third-party app like CleanMyMac.


