Monitoring memory usage is an important task for system administrators to ensure that a Linux system always operates at optimal levels. There are several ways to monitor memory usage in Linux, and this article will introduce some of the most common methods.
One popular method is to use the top command, which provides a dynamic real-time view of a running system. The `top` command displays system summary information as well as a list of tasks currently being managed by the Linux kernel. By default, the `top` command is installed on almost all Linux distributions.
Another similar tool is htop, which provides more information than `top` and has a more user-friendly interface. `htop` also allows users to scroll the list of processes vertically and horizontally, making it easier to view full command lines. However, `htop` may not be installed by default, and users may need to install it manually.
In addition to `top` and `htop`, there are also other tools available for monitoring memory usage in Linux, such as vmstat, free, atop, glances, ps, pidstat, and nmon. Each of these tools has its own unique features and capabilities, and users can choose the one that best suits their needs.
By utilising these tools, system administrators can effectively monitor memory usage in Linux and ensure that their systems are operating efficiently.
What You'll Learn

Using the 'free' command
The `free` command is a useful tool for monitoring memory usage in Linux. It provides a detailed report on the system's memory usage, including information about the total amount of physical and swap memory, as well as the free and used memory.
When used without any options, the `free` command displays information about the memory and swap in kibibytes (KiB). The output includes three lines: a header, one line for memory, and one for swap.
Here's an example of the output:
Total used free shared buff/cache available
Mem: 8075208 3204964 1310540 551232 3559704 4198340
Swap: 2097148 0 2097148
Let's break down what each column means:
- `total`: The total amount of memory that can be used by applications.
- `used`: The amount of used memory, calculated as `total - free - buffers - cache`.
- `free`: The amount of free/unused memory.
- `shared`: This column can be ignored as it is only for backward compatibility.
- `buff/cache`: The combined memory used by kernel buffers, page cache, and slabs. This memory can be reclaimed by applications if needed. To display buffers and cache in separate columns, use the `-w` option.
- `available`: An estimate of the amount of memory available for starting new applications without swapping.
The `free` command also allows you to specify the unit of measurement. You can use options like -b (bytes), -k (kilobytes), -m (megabytes), -g (gigabytes), and more. For example, to display the output in megabytes, you can use the -m option.
To view the memory information in a human-readable format, you can use the -h option. This will automatically choose the appropriate unit (usually megabytes or gigabytes) for each memory figure.
If you want to continuously monitor memory usage over time, you can use the -s or `--seconds` option followed by a number specifying the delay in seconds. For example, to print the memory information every 5 seconds, you would use:
Free -s 5
To display the output a specific number of times, you can use the -c or `--count` option. For example, to run the command 10 times, you would use:
Free -c 10
You can also combine options to customize the output further. For instance, to display the output in human-readable form with a 5-second delay, 20 times, you can use:
Free -h -s 5 -c 20
The `free` command is a versatile tool that allows you to monitor memory usage in Linux and customize the output to your needs.
Amazon's Monitoring: VLC Usage on Firestick Under Surveillance
You may want to see also

Using the 'vmstat' command
The vmstat command (short for virtual memory statistics) is a built-in monitoring utility in Linux that reports virtual memory statistics. It provides a snapshot of the system's virtual memory statistics, including processes, memory, paging, block IO, traps, and CPU activity.
The basic vmstat syntax is:
Vmstat [options][delay [count]]
- Options: Various switches to customise the output.
- Delay: Defines the time elapsed between output updates.
- Count: The number of output updates after the specified delay interval. If count isn’t set, the default value is infinite.
Procs -----------memory---------- ---swap-- -----io---- -system-- ------cpu-----
R b swpd free buff cache si so bi bo in cs us sy id wa st
1 0 0 6012852 2120 817048 0 0 2805 289 797 657 21 7 71 1 0
You can see information about processes, memory, swap, IO, system, and CPU.
- Swpd: The amount of virtual memory used.
- Free: The amount of idle memory.
- Buff: The amount of memory used as buffers.
- Cache: The amount of memory used as cache.
To display active and inactive memory, you can use the -a option:
Procs -----------memory---------- ---swap-- -----io---- -system-- ------cpu-----
R b swpd free inact active si so bi bo in cs us sy id wa st
0 0 0 6022104 609656 1185980 0 0 180 40 80 79 1 1 98 0 0
This replaces the buff and cache memory columns with inact and active columns, displaying the amount of inactive and active memory in the system.
You can also use the -s option to display various memory statistics, including total, used, inactive, and free memory:
8161656 K total memory
1216012 K used memory
1186276 K active memory
609632 K inactive memory
6021980 K free memory
2120 K buffer memory
By default, the vmstat command displays memory statistics in kilobytes. To change the output units, you can use the -S option with the following arguments:
- K: Display statistics in kilobytes.
- M: Display statistics in megabytes.
- K: Display statistics in hexadecimal kilobytes.
- M: Display statistics in hexadecimal megabytes.
For example, to update the statistics every 5 seconds and change the display units to megabytes, you can use the following command:
Vmstat -S m 5
This will provide a continuous update of memory usage statistics, allowing you to monitor memory utilisation over time.
Monitoring Data Usage: Your Nighthawk Router Guide
You may want to see also

Using the 'top' command
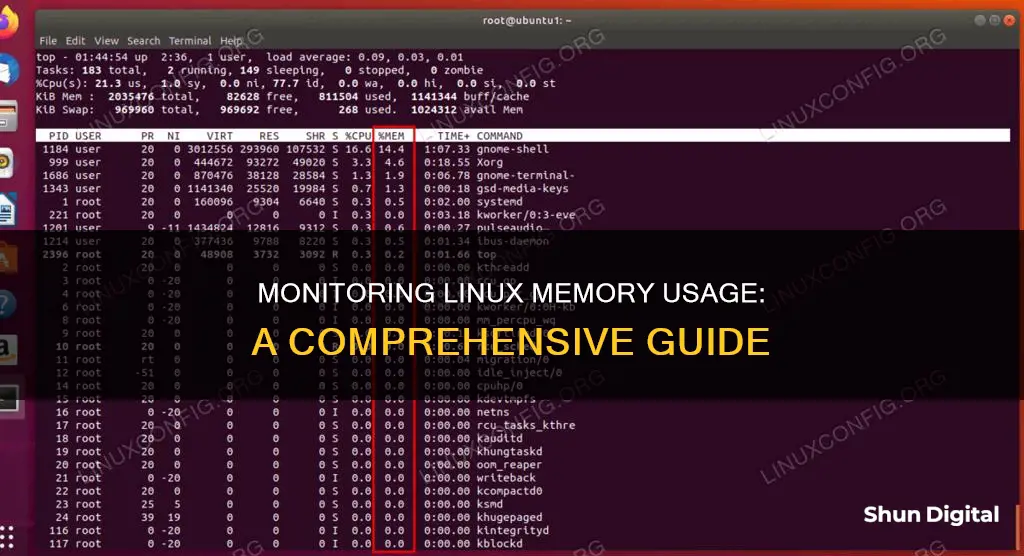
The top command is an essential tool for monitoring CPU and memory usage on a per-process basis. It provides a dynamic, real-time view of a running system, allowing you to monitor memory and swap usage statistics for each process.
To launch the top command, simply enter "top" in your terminal. The system will display information such as the number of running tasks, the number of logged-in users, CPU utilisation for each CPU or core, and memory usage statistics.
The top command also has an interactive interface that allows you to sort processes, change display settings, and manage operations without leaving the tool. For example, you can press Shift+m to sort the programs by memory usage, enabling you to quickly identify processes that are consuming the most memory.
Additionally, the top command provides real-time updates on your swap space usage. This can be particularly useful if you need to monitor a particular application's memory usage, such as Chrome or Firefox, which tend to have multiple processes running simultaneously.
If you want to focus specifically on memory usage, you can use the command "top -o %MEM", which will sort all processes based on memory consumption.
It's worth noting that the top command is not ideal if you only need to see the amount of free and used memory on your system. In such cases, the "free" command might be a better option.
Overall, the top command is a versatile and powerful tool for system administrators to monitor memory usage and identify potential issues related to memory consumption.
IBM Employee Internet Usage: Monitored or Not?
You may want to see also

Using the 'htop' command
The htop command is a useful tool for monitoring memory and CPU usage in Linux. It provides an interactive process viewer with several enhancements over similar commands, such as top.
To begin using htop, you may need to install it on your system. You can do this by using the appropriate command for your Linux distribution:
- Sudo apt install htop (Ubuntu, Debian)
- Sudo dnf install htop (RHEL 8+, CentOS Stream)
- Sudo zypper install htop (openSUSE, SUSE)
Once htop is installed, simply type "htop" into your terminal to launch it. The output will be divided into two main sections:
- The top segment: This provides a summary of the system's performance and includes graphic meters and text counters.
- The lower section: This section displays detailed data for each process. Here, you can perform actions on individual processes and use shortcuts to manipulate and customise them without typing commands.
To view memory usage with htop, you can press F6 and then use the arrow keys to select "%MEM". This will sort the processes by memory usage, allowing you to easily monitor which processes are using the most memory.
You can also customise the htop output to display memory usage in different units. By default, htop displays memory usage as a percentage. However, you can change it to display memory usage in GB by pressing F2 to access the settings, navigating to the "Available Columns" menu, and selecting "M_RESIDENT". This will add a new column showing the amount of RAM used by each process in GB.
In addition to monitoring memory usage, htop also provides information on CPU utilisation, the number of running tasks, logged-in users, and more. You can exit htop at any time by pressing "q".
Energy Monitoring in Schools: Strategies and Solutions
You may want to see also

Using the 'sar' tool
The sar tool is used to monitor system performance and resource usage in Linux. It is a part of the sysstat package and can be used to monitor CPU usage, memory utilization, I/O devices, network statistics, disk usage, and more.
To display memory usage details, including the amount of memory used, amount of memory free, available cache, and available buffers, you can use the following command:
Bash
Sar -r 1 3
This will report memory usage every 1 second, for a total of 3 times.
To display free and used memory, you can use the following command:
Bash
Sar -r
You can also add additional parameters, such as "1 3", to report every 1 second for a total of 3 times.
To display swap space usage, including the amount of swap space in use and the percentage of swap space used, you can use the following command:
Bash
Sar -S
Again, you can add parameters such as "1 3" to report at specific intervals and repeat a certain number of times.
To identify the number of memory pages that the system has freed, used, and cached, you can use the following command:
Bash
Sar -R
To generate paging statistics, such as the number of pages paged in and out from disk per second, you can use the following command:
Bash
Sar -B
To generate page swap statistics, such as the number of pages swapped in and out per second, you can use the following command:
Bash
Sar -W
Water Usage Monitoring in California: How Does It Work?
You may want to see also
Frequently asked questions
You can use the following commands:
- free
- vmstat
- top
- htop
- cat /proc/meminfo
You can use the watch command to continuously monitor memory usage. For example, watch -n 5 free will update the `free` command output every 5 seconds.
You can use the `top` command with the `-p` option to monitor a specific
You can use the `free` command with the -s and -c options to specify the interval and number of updates. For example, `free -s 5 -c 20` will update the memory usage every 5 seconds for 20 times.


