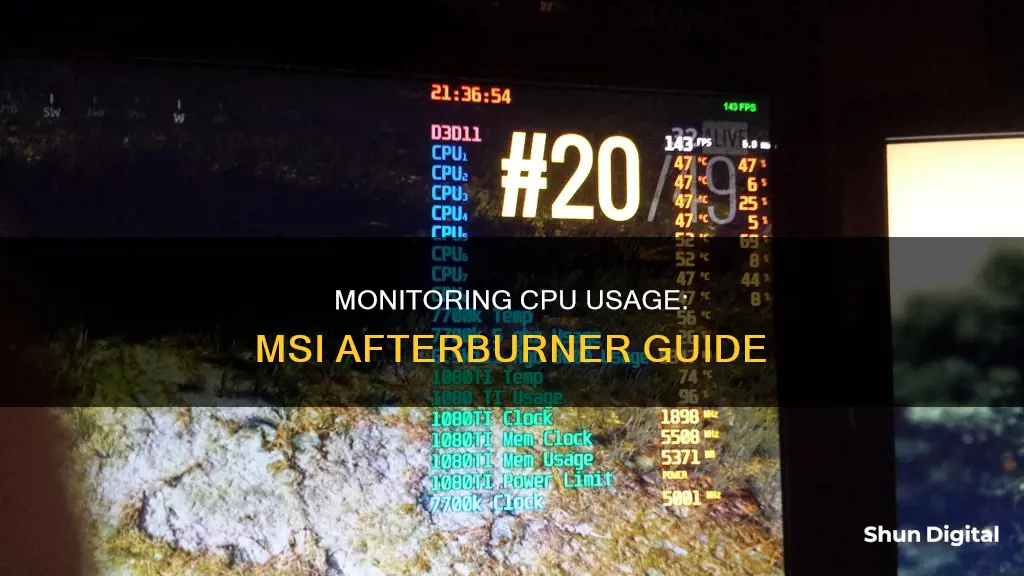
Monitoring your CPU usage is an important way to know if you're getting the best performance out of your processor. One way to do this is by using MSI Afterburner, which works with the RivaTuner Statistics Server from Guru3D.com to display real-time performance while gaming. After downloading and installing both applications, you can open the Afterburner interface and tweak the data, such as the frequencies of the GPU and memory clocks, voltage, and current temperature. To monitor your CPU usage, navigate to the Monitoring tab and select which aspects of your system you want to be displayed in the on-screen overlay.
| Characteristics | Values |
|---|---|
| Software | MSI Afterburner, Riva Tuner Statistics Server (RTSS), HWInfo64, HWMonitor |
| Compatibility | Windows 10, Windows 11 |
| Installation | Download and install MSI Afterburner and RTSS, ensure "CPU POWER" is selected under "Active hardware monitoring graphs" in the Monitoring tab of the MSI Afterburner settings, set a custom hotkey for "Toggle On-Screen Display" |
| Usage | Launch MSI Afterburner and RTSS, run a game, use the hotkey to display CPU usage on-screen |
What You'll Learn

Download and install MSI Afterburner
To download and install MSI Afterburner, follow these steps:
First, head to the official website to download the software. MSI Afterburner is a free utility that works with all graphics cards, regardless of whether you have an Nvidia or AMD-based GPU. It is also available in multiple languages.
Once you've downloaded the zip file, unzip and install the app. During installation, make sure not to uncheck the box for installing the Riva Tuner Statistics Server (RTSS), which works with MSI Afterburner to display real-time performance while gaming.
After installation, open MSI Afterburner. You will be asked to provide special privileges for the app, so be sure to click "Yes" to continue.
Now, you can begin to customise the app's settings. Click on the settings cog button to open the MSI Afterburner properties window. Here, you can modify the app's settings to your liking.
Navigate to the "Monitoring" tab. This is where you select which aspects of your system will be monitored and which will be displayed in the on-screen overlay. Tick every entry titled "CPU Usage" under "Active Hardware Monitoring Graphs". Each one of these entries represents a logical CPU in your computer, so the number will differ depending on your hardware setup.
Finally, click "Show in on-screen display" to ensure that the monitored CPUs appear when you run your game or 3D app.
Firefox and User Privacy: Monitoring Usage and Data
You may want to see also

Open the app and click the Settings cog
Once you have downloaded and installed MSI Afterburner, you will be asked to provide special privileges for the app. You must say "Yes" to continue.
Now, open the app and click the Settings cog. This will open the MSI Afterburner properties window, where you can modify its settings.
From here, you can navigate to the "Monitoring" tab. This is where you can select which aspects of your system will be monitored and which will be displayed in the on-screen overlay. Tick every entry titled "CPU Usage" under "Active hardware monitoring graphs". Each one of these entries represents a logical CPU in your computer.
You can also highlight multiple CPU usage entries by holding Shift and clicking, then selecting "Show in on-screen display". This will ensure that these monitored CPUs appear in the on-screen display.
You can further customize the on-screen display by navigating to the "On-screen Display" tab and setting a shortcut. By default, the "Toggle on-screen display" shortcut is set to the "Home" key, but you can change it to whichever key you prefer.
Once you have made your selections, click "OK" and run your game. With your choices locked in, run your game or 3D app, and all of the CPU usage measurements should appear. If you don’t see anything, use the toggle you set. If that doesn’t work, make sure MSI Afterburner is running in the background.
Internet Privacy: Government Surveillance and Online Monitoring
You may want to see also

Navigate to the Monitoring tab
To monitor your CPU usage with MSI Afterburner, you'll need to download and install both the MSI Afterburner app and the RivaTuner Statistics Server (RTSS) from Guru3D.com.
Once you've installed both applications, open the MSI Afterburner app. You'll see an interface with two dials that show the current status of your graphics cards, including GPU and memory clock frequencies, voltage, and current temperature.
Now, let's get to the Monitoring tab. Click the Settings cog, then click "Monitoring". This is where you decide which aspects of your system will be monitored and which will be displayed in the on-screen overlay.
In the Monitoring tab, you'll find a ton of various settings and options. The section you're most interested in is "Active hardware monitoring graphs". This is where you'll be enabling (or disabling) the statistics you want to be displayed on your on-screen display (OSD).
To add or remove graphs from your OSD, you can either go through each item one-by-one and tick or untick "Show in On-Screen Display", or you can select multiple items at once by holding Ctrl and Shift while clicking on the graphs you want. Then, simply tick "Show in On-Screen Display".
Once you've added all the items you want to monitor, make sure to click "Show in on-screen display" for each item. This ensures that the monitored items will appear in the on-screen display.
Now, you're ready to launch your game or 3D app and start monitoring your CPU usage!
BlueCross CPAP Usage: Monitored for Better Sleep and Health
You may want to see also

Highlight the CPU Usage stats you want to see
To highlight the CPU Usage stats you want to see, you'll need to download and install the MSI Afterburner application. This software is primarily an overclocking tool for enhancing graphics card performance, but it can also display real-time performance stats while gaming when combined with the Riva Tuner Statistics Server (RTSS).
Once you've installed both applications, open MSI Afterburner and click the Settings cog to access the properties window. Navigate to the "Monitoring" tab, where you can select which system aspects will be monitored and displayed in the on-screen overlay. Tick every entry titled "CPU Usage" under "Active Hardware Monitoring Graphs". These entries represent the logical CPUs in your computer, so the number will vary depending on your hardware configuration.
After selecting all the relevant CPU Usage entries, hold Shift and click on each one to highlight them. Then, click on "Show in on-screen display" to ensure that these monitored CPUs are visible during gameplay.
You can further customise the on-screen display by navigating to the "On-screen Display" tab and setting a shortcut to toggle the display. By default, the shortcut is set to the "Home" key, but you can change it to any key combination that suits you better.
With these settings in place, launch your game or 3D application. All the CPU Usage measurements you selected should now be visible on-screen. If they're not, use the toggle shortcut you set up earlier or ensure that MSI Afterburner is running in the background.
Monitoring Energy Usage: A Guide to Understanding Your Consumption
You may want to see also

Set up a shortcut to toggle the on-screen display
To set up a shortcut to toggle the on-screen display of your CPU usage, you'll need to download and install two applications: MSI Afterburner and RivaTuner Statistics Server (RTSS). MSI Afterburner is primarily an overclocking tool for your graphics card, but it can also display real-time performance while gaming when used with RTSS.
Here's a step-by-step guide to setting up a shortcut to toggle the on-screen display:
- Download and install MSI Afterburner from the official landing page.
- During the installation process, you'll be asked to choose the components. Make sure to keep the RivaTuner Statistics Server checkbox checked to install it alongside MSI Afterburner.
- Once the installation is complete, launch MSI Afterburner.
- In the MSI Afterburner window, click on the gear icon to access the advanced properties.
- Go to the "Monitoring" tab.
- In the "Active Hardware Monitoring Graphs" section, select the parameters you want to display on-screen, such as CPU usage, GPU usage, or temperature.
- For each selected parameter, make sure to check the "Show in On-Screen Display" checkbox.
- Click on the "Apply" button to save your changes, then click "OK".
- Keep the MSI Afterburner application open.
- In the system tray, locate the RivaTuner Statistics Server icon (a computer monitor with a "60" on it) and right-click on it.
- Select "Show" and ensure that the "Show On-Screen Display" option is enabled.
- You can now set up your hotkey to toggle the on-screen display. Go back to the MSI Afterburner window and click on the "Settings" cog.
- In the window that appears, click on "On-Screen Display".
- In the "Global On-Screen Display Hotkeys" section, you can set your desired hotkey combination to toggle the on-screen display. You can use the default hotkey or set a custom one.
- Once you've set your hotkey, you can now launch a game and press the assigned hotkey to toggle the on-screen display of your CPU usage.
By following these steps, you'll be able to easily set up a shortcut to monitor your CPU usage with MSI Afterburner and RivaTuner Statistics Server.
Monitoring Data Usage: Track Device Consumption
You may want to see also
Frequently asked questions
After downloading and installing MSI Afterburner, open the app and click the Settings cog. In the window that appears, click "On-Screen Display" and then the Monitoring tab. Here, you can select which aspects of your system will be monitored and displayed in the on-screen overlay. Tick every entry titled "CPU Usage" under "Active hardware monitoring graphs".
To display the on-screen overlay while gaming, you will need to download and install RivaTuner Statistics Server (RTSS) in addition to MSI Afterburner. Once you have downloaded and installed RTSS, open the app and ensure that "Show On-Screen Display" and "On-Screen Display Support" are both turned on.
You can display CPU usage, CPU clocks, temperature, RAM usage, and power.


