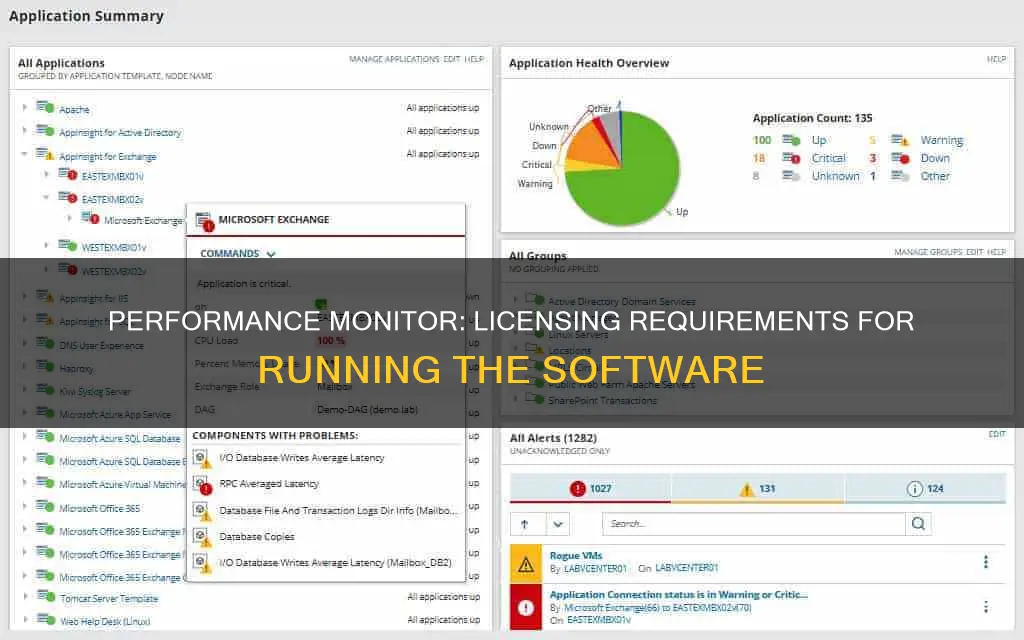
Performance monitoring is an important aspect of system administration, and different tools are available for this purpose, such as Windows Performance Monitor and Network Performance Monitor (NPM). When it comes to licensing requirements for running performance monitors, it depends on the specific tool and the environment in which it is being used. For example, when using Windows Performance Monitor, certain permissions and access rights are needed, such as being a member of the Performance Log Users group and having read access to the remote registry. On the other hand, when using NPM, Microsoft licenses may be required, such as Windows Server and SQL licenses. Additionally, different permissions are needed for monitoring specific components, such as Active Directory, event logs, and performance counters. In some cases, issues with performance monitoring may be related to firewall settings or corrupted registry settings.
What You'll Learn

Windows-specific monitor permissions
When it comes to Windows-specific monitor permissions, there are several considerations to keep in mind. Firstly, if you are attempting to connect to a remote server, you need to ensure that the necessary exceptions are enabled in the Windows firewall. This includes allowing access for Performance Logs and Alerts.
Secondly, the user attempting to connect must have the appropriate group memberships on the server or domain. Specifically, they should belong to the Performance Log Users, Performance Monitor Users, and Event Log Readers groups.
Additionally, the Remote Registry service on the server needs to be running for successful connections.
When granting permissions to applications, simply adding the application to the "Performance Monitor Users" group may not be sufficient. For certain performance counters, the application may require administrative privileges.
It is worth noting that some performance counters, such as those related to physical memory usage, may require specific permissions or configurations to access.
Monitoring Internet Usage: Strategies for Parents and Guardians
You may want to see also

Active Directory Change Monitor
For more comprehensive monitoring, third-party solutions are available, such as:
- SolarWinds Server & Application Monitor (SAM): This tool helps monitor Active Directory health, including logins, Windows Events, and replication issues. It also provides detailed AD site views and insights into domain controllers.
- Paessler PRTG Network Monitor: This solution offers comprehensive monitoring of entire IT networks, including changes to AD groups, replication issues, and inactive accounts.
- Anturis Active Directory Monitoring: A cloud-based application that audits domain controller performance and health and tracks login attempts, password changes, and other security-related events.
- ManageEngine ADAudit Plus and ADManager Plus: These tools offer real-time monitoring of user activity and changes in the AD environment, with detailed audit reports to identify security risks and ensure compliance.
- Netwrix Auditor for Active Directory: Provides comprehensive Active Directory monitoring, including tracking and reporting on user activity, changes to Group Policy, and access permissions. It also offers advanced reporting and real-time alerts on critical changes.
When considering licensing requirements for these tools, it is important to review the specific vendor's information. For example, SolarWinds SAM offers a 30-day free trial, while Paessler PRTG has a freeware edition with limited features, and a paid version with additional sensors available for purchase. Netwrix's products also offer free trials, and their website provides further information on licensing requirements.
Glucose Self-Monitoring: What Insights Can You Gain?
You may want to see also

Event Log-based Monitors
The Event Log-based Monitors require specific permissions to access the event logs. By default, the Application and System event logs can be viewed by the "Everyone" group. However, to view the Security event log, the account must have the "Manage auditing and security log" user right. These default security settings can be customised via registry settings. Additionally, to create a complete event description, the account needs to be able to read the remote registry and map to an admin share to extract resource strings from DLLs. This also implies that the Remote Registry service should be running on the remote machine.
When setting up an Event Log-based Monitor, it is important to specify the name of the event log being monitored, such as Application, Security, or System, and the computer where the event log is stored. Advanced configurations can also be set, such as filtering events based on specific criteria like event ID, source, type, or description.
One example of an Event Log-based Monitor is the "Events: Failed Replication" component monitor, which tracks the number of times replication failed on a target node. This monitor can be found in the Active Directory 2016 Services and Counters template.
Disassembling Your ASUS Monitor: A Step-by-Step Guide
You may want to see also

Performance Monitor Users group
The Performance Monitor Users group is a default security group in the Windows Server operating system. Members of this group can monitor performance counters on domain controllers in the domain, both locally and from remote clients, without being part of the Administrators or Performance Log Users groups.
The Windows Performance Monitor is an MMC snap-in that provides tools for analyzing system performance. It allows users to monitor application and hardware performance, customize data collection in logs, define thresholds for alerts and automatic actions, generate reports, and view past performance data in various ways, all from a single console.
Members of the Performance Monitor Users group have access to all the features available to the Users group. They can view real-time performance data in Performance Monitor and change the display properties while viewing data. However, they cannot create or modify Data Collector Sets.
To add a user account to the Performance Monitor Users group, log in to the remote computer as an administrator. Then, open the Computer Management window, expand System Tools, expand Local Users and Groups, and click on Groups. Double-click on Performance Monitor Users and click Add. Enter the name of the user account or group account you want to add and click OK.
It is important to note that users who are members of only the Performance Monitor Users group may still receive an "Access Is Denied" error message when trying to access the Performance Monitor on a remote computer. To resolve this issue, ensure that the user account is also added to the Performance Log Users group on the remote computer.
Asus Monitors: DVI Cable Inclusion or Exclusion?
You may want to see also

Remote Ports
Windows-specific Monitors
Windows-specific monitors, such as the Event Log monitor, Service monitor, and Performance monitor, typically utilise standard Windows RPC (Remote Procedure Call) to access the required resources. By default, Windows RPC uses TCP port 135, although this can be changed using tools available on the Microsoft website. It is important to note that port 135 is frequently targeted by malware and worms, so it is not recommended to open this port on an Internet-facing firewall.
Dynamic Port Range
In addition to port 135, RPC also employs a dynamic port range that is established between the endpoints. The default dynamic port range for Windows Vista and newer operating systems is 49152-65535, while older Windows systems use a range of 1025-5000. It is crucial to ensure that these dynamic port ranges are open in the firewall configuration when troubleshooting Perfmon connectivity issues.
Windows SMB/CIFS
Windows SMB (Server Message Block) is another protocol used for file serving and accessing underlying files and directories. The default port for Windows SMB is TCP port 445. Similar to port 135, this port is often targeted by malware and worms, so it is not advisable to open it on an Internet-facing firewall. CIFS (Common Internet File System) is another file-sharing protocol that is similar to SMB and supported by Linux via SAMBA and other operating systems.
Remote Permissions
To allow attaching a remote performance monitor, certain permissions are required. Your user account should belong to the Performance Log Users, Performance Monitor Users group, and the Event Log Readers group on the server or domain. Additionally, ensure that the Remote Registry service is running on the server.
Collector Setup
When setting up a collector to pull Windows performance monitor logs, there are several prerequisite tasks. The collector must be in the same domain as the systems it will collect data from. Create a domain user who is also a member of the local administrator group on the target machine. Configure the Windows firewall to allow RPC connections inbound and ensure that the Remote Registry service is running.
Ports for RPC Traffic
To configure the firewall to allow RPC traffic, go to Firewall > Advanced Settings > Inbound Rules > New Rule. Select the Windows Protocol and ports, specifically:
- Local Port: RPC Dynamic Ports
- TCP Port 135 (DCE/RPC Locator Service)
- TCP Port 139 (NetBIOS Session Service)
- TCP Port 445 (Windows Shares)
These ports are crucial for communication between the collector and the target system.
Monitoring Data Usage on Your iPad: A Guide
You may want to see also
Frequently asked questions
Yes, you need a Microsoft license to run Performance Monitor.
You need to be an administrator to run Performance Monitor. You also need to be a member of the "Performance Monitor Users" group.
Some common issues with running Performance Monitor include not having the correct permissions and not being able to connect to a remote computer.


