Extracting Performance Monitor Data: A Step-By-Step Guide

how to pull data from performance monitor

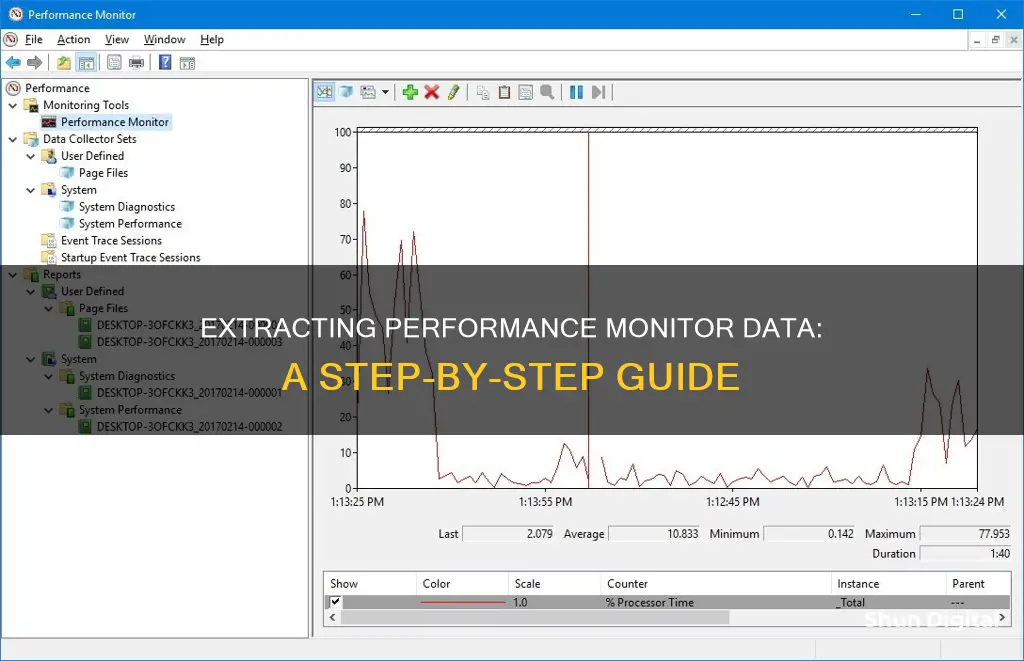
Performance Monitor is a tool that can be used to pull data and monitor performance on Windows operating systems. It allows users to view and analyse data related to hardware and application performance, helping to identify and troubleshoot potential issues. The data collected by Performance Monitor is stored in log files, which can be customised and configured to monitor specific aspects of system performance. With Performance Monitor, users can gather detailed information such as CPU usage, memory usage, network adapter performance, and more. This tool is particularly useful when trying to understand and optimise system performance.

shundigital

Using Data Collector Sets

Data Collector Sets are a crucial feature of Performance Monitor, allowing you to

shundigital

Viewing log files

To view log files in Performance Monitor, you must first create a Data Collector Set. This is how Performance Monitor stores the data it collects.

To create a new Data Collector Set:

  • Click the Windows Start menu and search for "performance".
  • Right-click Performance Monitor and then click "Run as administrator".
  • In the left pane, click "Data Collector Sets".
  • In the right pane, right-click "User Defined", click "New", and then click "Data Collector Set".
  • In the Create new Data Collector Set wizard, enter a name for the data collector set.
  • Select "Create manually (Advanced)" and then click "Next".
  • Under "Create data logs", select "Performance counter", and click "Next".
  • Set the sample interval (e.g. to 30 seconds).
  • Select the computer that you want to record-performance data for. If you are running the program on a single computer, select "".
  • Select performance counters from the list.
  • Browse to the directory where you want to store the data, and then click "Next".
  • In the left pane of the main Performance Monitor window, select the data collector set that you created.
  • In the right pane, right-click the performance counter and then click "Properties".
  • Select "Comma separated" as the log format and then click "OK".

Once you have created a Data Collector Set, you can view the log file by following these steps:

  • Start Windows Performance Monitor.
  • Choose Start, in the Search box, type "perfmon", and then choose the related link.
  • In the navigation pane, expand "Monitoring Tools", and then choose "Performance Monitor".
  • In the console pane toolbar, choose the "View Log Data" button.
  • The Performance Monitor Properties page opens at the "Source" tab.
  • In the "Data Source" section, select "Log files", and then choose the "Add" button.
  • Browse to the log file that you want to view, and then choose the "Open" button.
  • Choose the "OK" button.

shundigital

Creating custom Data Collector Sets

Opening the Performance Monitor: Click on the Windows Start menu and

shundigital

Running and stopping Data Collector Sets

To start collecting data using a Data Collector Set in Performance Monitor, you must first create a new data collector set. This can be done by searching for "performance" in the Windows Start menu, right-clicking on Performance Monitor, and then clicking "Run as administrator". In the left pane, click "Data Collector Sets", then right-click on "User Defined", click "New", and then "Data Collector Set". Name the data collector set, select "Create manually (Advanced)", and then click "Next".

Under "Create data logs", select "Performance counter" and click "Next". Set the sample interval, select the computer you want to record performance data for, and then select the performance counters you want to use. Once you have selected the performance counters, click "OK" and then "Next".

Browse to the directory where you want to store the data and then click "Next". It is important to store the data in a place that is accessible by the program you are using Performance Monitor with. In the left pane of the main Performance Monitor window, select the data collector set that you created, then, in the right pane, right-click the performance counter and click "Properties". Select the log format and then click "OK".

In the left pane, right-click the name of the data collector set and click "Start". Performance Monitor will then start monitoring your server and storing information in the location that you specified.

To stop collecting data, right-click the Data Collector Set and then choose "Stop".

shundigital

Configuring the Performance Monitor

To configure the Performance Monitor, you must first open the tool. On Windows 10, there are three ways to do this:

  • Open Start, search for Performance Monitor, and click the result.
  • Use the Windows key + R keyboard shortcut to open the Run command, type "perfmon", and click OK.
  • Use the Windows key + X keyboard shortcut to open the Power User menu, select Computer Management, and click on Performance.

Once Performance Monitor is open, you can begin to set up and customise your performance counters. To do this:

  • Click the green plus button above the Performance Monitor graph.
  • Select Local Computer or the name of your computer from the drop-down menu.
  • Select and expand the category of the item you want to monitor. For example, if monitoring network performance, select the "Network Adapter" category.
  • Select the counters you want to monitor (e.g., Bytes Total/sec). To add multiple counters, press and hold the Ctrl key and click to select each item. You can also check the Show description option to get more information about the counter you're selecting.
  • If applicable, select the instances you want to monitor. For example, on Network Adapter, you can monitor one or multiple network adapters simultaneously.
  • Click the Add button, then click OK to confirm and add the new counters.

After configuring your counters, you can customise the Performance Monitor view. To do this:

  • Double-click one of the counters to open the Performance Monitor Properties window.
  • On the "Data" tab, select the counter you want to customise.
  • At the bottom, choose the colour, scale, width, and style you want to use.
  • Repeat steps 2 and 3 for each item you want to customise. To change the properties for multiple counters, press and hold the Ctrl key, select each item you want to customise, and change the available settings.
  • You can also change the graph's style by clicking the "Change graph type" in the toolbar and selecting one of the available views, including Line, Histogram bar, and Report.

In addition to the basic counters and customisations, you can also create custom Data Collector Sets, which allow you to create custom sets containing performance counters and alerts based on specific criteria. To create a custom Data Collector Set:

  • In Performance Monitor, expand Data Collector Sets.
  • Right-click "User Defined", select New, and click on Data Collector Set.
  • Type a descriptive name for the new set.
  • Select the Create manually (Advanced) option.
  • Select Create data logs and check the Performance counter option, or use other options as needed.
  • Click the Add button.
  • Pick and add the performance counters you want.
  • Configure the sample interval, which defines how often Performance Monitor will run and collect data. Shorter intervals ensure that counters log information more frequently.
  • You can leave the default settings or save your set in another location.
  • The set will run automatically no matter who is signed into Windows 10, but you can choose a specific user if desired.
  • Check the Save and Close option.

Once you've completed these steps, you can right-click your Data Collector Set under "User Defined" and click Start to run it or Stop to shut it down.

Frequently asked questions

Written by
Reviewed by
Share this post
Print
Did this article help you?

Leave a comment