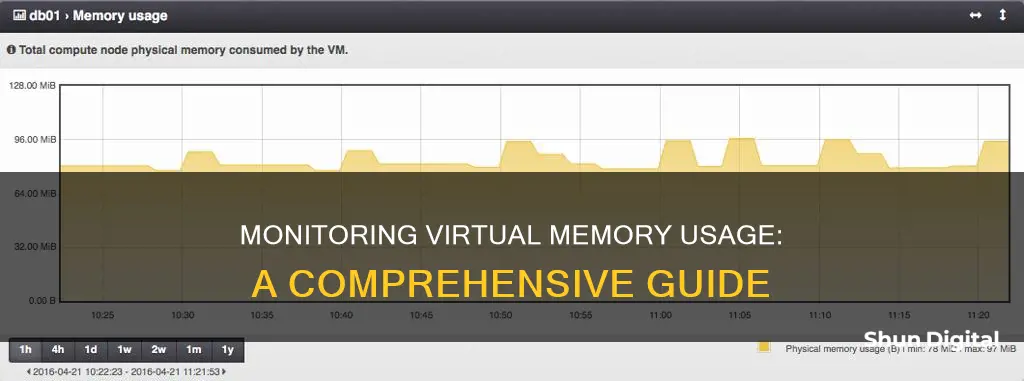
Virtual memory is a memory management technique that allows operating systems to extend available RAM by using disk space. It creates the illusion of larger memory space, enabling efficient multitasking and memory utilisation. Monitoring virtual memory usage is crucial to maintaining system efficiency and preventing performance bottlenecks. On Windows, the Task Manager provides insights into virtual memory usage under the Performance tab. For Linux users, commands like free, top, and vmstat are essential for monitoring memory usage and preventing high swap usage, which can severely impact performance.
| Characteristics | Values |
|---|---|
| Windows application to monitor virtual memory activity | VMMap, Performance Monitor, Resource Monitor |
| Linux virtual memory monitoring | free, top, vmstat commands |
| Windows virtual memory monitoring | Performance Monitor |
What You'll Learn
- Using the 'free' command to monitor physical memory usage
- Using the 'top' command for real-time stats on physical memory usage
- Using the 'free -t' command to monitor virtual memory usage
- Using the 'vmstat' command to monitor the virtual memory paging rate
- Using the 'Performance Monitor' tool to monitor RAM and virtual memory usage

Using the 'free' command to monitor physical memory usage
The `free` command is a simple way to monitor physical memory usage in Linux. It provides a snapshot of the total amount of free and used physical memory, as well as information about swap memory, buffers, and caches used by the kernel. The output includes:
- Total installed memory
- Memory currently in use (excluding buffers and cache)
- Memory used by tmpfs and shared between processes
- The sum of buffer and cache memory, which the OS uses to speed up processes
- An estimate of how much memory is available for new applications without swapping
You can customize the output of the `free` command by adding flags. For example:
- `-b` changes memory usage/availability figures to bytes
- `-k` changes memory usage/availability figures to kilobytes
- `-m` changes memory usage/availability figures to megabytes
- `-g` changes memory usage/availability figures to gigabytes
- `--low` shows detailed low and high memory statistics
- `--old-format` reverts output to an old format without the `-/+buffers/cache` line
- `--total` shows the total sum of RAM and swap memory
- `--delay [delay]` updates the output every [delay] seconds
- `--count [count]` updates the output [count] times
The `free` command is a useful tool for system administrators to monitor memory usage and ensure optimal performance.
Monitoring Comcast Data Usage: Tips and Tricks
You may want to see also

Using the 'top' command for real-time stats on physical memory usage
The top command is a powerful tool for monitoring system performance in real-time, including memory and CPU usage. It provides a dynamic, real-time view of a running system, allowing you to check memory usage on a per-process basis. This is particularly useful when multiple iterations of the same command are consuming different amounts of memory.
To launch the top command, simply enter "top" in your terminal. By default, it displays critical system information such as:
- The number of running tasks
- The number of logged-in users
- CPU utilisation for each CPU or core
- Memory and swap usage statistics for processes
The data is continuously updated, enabling you to track process activity and system resource utilisation in real-time. Additionally, the top command includes an interactive interface that lets you sort processes, change display settings, and manage operations without leaving the tool.
If you want to focus specifically on memory usage, you can sort the output of the top command by memory utilisation. This can be achieved by using the "-o" or "-O" option followed by the desired field name. For example, "top -o %MEM" or "top -O mem" will sort the processes by memory usage, with "%MEM" or "mem" being the column name representing memory utilisation.
Another useful feature of the top command is the ability to press "Shift + M" after running the command, which will sort the processes by memory usage interactively. This provides a convenient way to quickly identify processes consuming the most memory.
The top command is a versatile and essential tool for system administrators, offering real-time insights into memory usage and overall system performance. Its interactive capabilities and customisation options make it a go-to choice for monitoring and optimising system resources.
Monitoring Children's Internet Usage: Parenting in the Digital Age
You may want to see also

Using the 'free -t' command to monitor virtual memory usage
The free -t command is a useful tool for monitoring virtual memory usage, specifically swap memory usage. It provides detailed insights into how your system is utilising virtual memory, which is critical for maintaining system performance and efficiency.
When you run the command "free -t" in your terminal, you will be presented with valuable information about your system's memory usage. Here is a breakdown of the output:
- Total: This represents the total amount of physical RAM installed on your system.
- Used: Indicates the amount of memory utilised by the processes. It can be calculated by subtracting the "free" and "buff/cache" values from the "total".
- Free: Displays the amount of memory that is not currently being used. This can be determined by subtracting the "used" and "buff/cache" values from the "total".
- Shared: Shows the memory shared among various system processes.
- Buffers and Cached: Represents the amount of memory set aside by the operating system as buffers and cache.
- Mem: Provides an overview of the total, used, and free memory, including shared buffers and cached memory.
- Swap: Offers insights into the swap space, including the total amount, as well as the used and free portions.
By understanding these values, you can make informed decisions about your system's memory management. For example, high swap usage indicates that your system is running low on physical memory, which can lead to potential performance issues.
Additionally, the "free -t" command allows you to customise the output to suit your needs. You can use flags such as "-b" for bytes, "-k" for kibibytes, "-m" for mebibytes, or "-g" for gigabytes. This flexibility ensures that you can adapt the output to your specific requirements or preferences.
It is worth noting that while the "free -t" command provides valuable insights into virtual memory usage, it is just one tool in your arsenal for monitoring system performance. Complementing it with other commands, such as vmstat and top, can give you a more comprehensive understanding of your system's memory utilisation.
How Dual Monitors Affect Disk Usage Performance
You may want to see also

Using the 'vmstat' command to monitor the virtual memory paging rate
The `vmstat` command (short for virtual memory statistics) is a built-in monitoring utility in Linux that provides insights into virtual memory paging rates and various other system metrics. Here's how you can use it to monitor virtual memory paging:
Basic Syntax
The basic syntax for the `vmstat` command is:
Vmstat [options] [delay] [count]
- `options`: Various switches to customize the output.
- `delay`: Defines the time interval between updates.
- `count`: The number of updates printed after the specified delay interval.
Displaying Virtual Memory Paging Rates
To monitor virtual memory paging rates, focus on the "swap" and "io" sections in the output. Here's what each field represents:
- `si`: The rate of swapping-in memory from disk (per second).
- `so`: The rate of swapping-out memory to disk (per second).
- `bi`: Blocks received from a block device per second.
- `bo`: Blocks sent to a block device per second.
Examples
To view the virtual memory paging rates, run the following command:
Vmstat
This will display the average statistics since the last boot, including the `si` and `so` fields, which indicate the swapping rates.
If you want to monitor the paging rates in real-time with a specific interval, you can use the `delay` and `count` parameters:
Vmstat
For example, to get updates every 5 seconds and display the statistics 3 times, you would use:
Vmstat 5 3
Customizing the Output
You can also customize the output to focus only on specific sections, such as memory and swap statistics, using the `-a` option:
Vmstat -a
This will replace the buffer and cache memory columns with inactive and active memory columns, giving you a detailed view of memory usage.
Additionally, you can change the units of the memory and swap statistics using the `-S` option:
Vmstat -S m
This will display the statistics in megabytes instead of the default kilobytes.
By utilizing the `vmstat` command and its various options, you can effectively monitor virtual memory paging rates and gain valuable insights into your system's performance. Remember to adjust the parameters and options according to your specific needs and always refer to the official documentation for further details.
Monitoring Employee Internet Usage: Free, Easy, and Effective Ways
You may want to see also

Using the 'Performance Monitor' tool to monitor RAM and virtual memory usage
Performance Monitor is a built-in Windows tool that can be used to monitor RAM and virtual memory usage. Here's a step-by-step guide on how to use it:
- Press Windows + R to open the Run dialog box.
- Type "perfmon" (without quotes) and press Enter. This will open the Performance Monitor tool.
- In the left-hand pane, expand the "Monitoring Tools" folder if it's not already expanded.
- Click on Performance Monitor to launch the main interface.
- In the main interface, you'll see a list of counters that you can monitor. Right-click in the graph area and select "Add Counters..." to choose the specific counters you want to track.
- In the "Available Counters" list, you can select various memory-related counters such as "Memory", "Pool Paged Bytes", "Pool Nonpaged Bytes", etc. Select the counters you want to monitor.
- Once you've added the desired counters, you can customize the graph and its appearance by right-clicking in the graph area and selecting "Properties...". Here, you can change the scale, colours, and other visual settings.
- You can also set alerts and thresholds for specific counters. For example, you can specify a threshold for available memory, and receive an alert when memory usage hits that limit.
- Performance Monitor allows you to monitor multiple counters simultaneously, giving you a comprehensive view of your system's memory usage.
- Additionally, you can use the "Process" counter to track memory usage by individual processes. This can help identify memory-intensive applications.
- Performance Monitor also provides real-time updates, allowing you to monitor memory usage dynamically.
- To stop or start monitoring, you can use the Monitor menu in the top left corner of the window.
Performance Monitor is a versatile tool that provides detailed insights into your system's memory usage. It allows you to track both physical and virtual memory, set alerts, and analyze memory consumption by specific processes. By utilizing this tool, you can optimize your system's performance, identify memory leaks, and ensure efficient memory management.
Monitoring Internet Usage on Your iPhone: A Step-by-Step Guide
You may want to see also
Frequently asked questions
You can use the Performance Monitor tool, which is part of Windows. This will give you an overview of memory usage, including virtual memory.
You can use the free, top, and vmstat commands to monitor memory usage on Linux. These commands provide information about both physical and virtual memory.
The free command gives a quick snapshot of memory usage, while the top command offers real-time memory usage statistics, making it ideal for ongoing monitoring.
The vmstat command can be used to monitor the rate of memory pages being moved from physical memory to disk. Specifically, look at the si (pages swapped in) and so (pages swapped out) columns.


