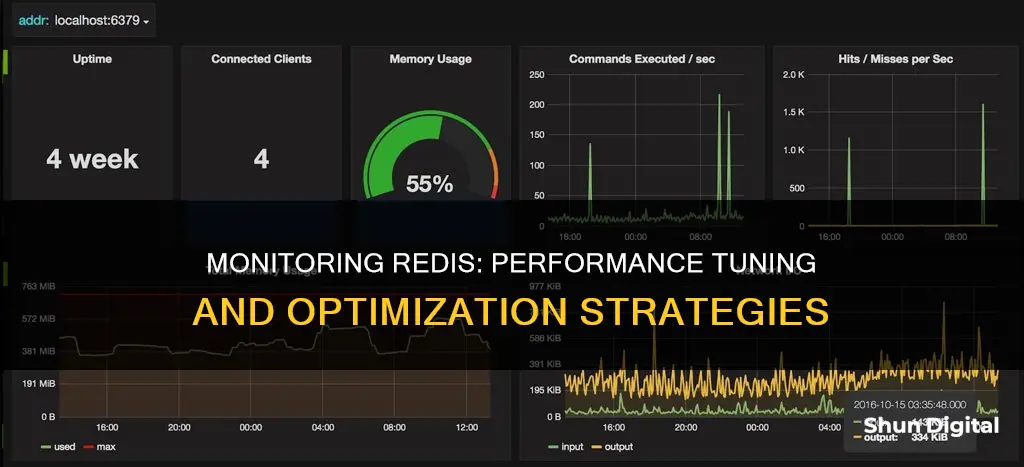
Redis is a popular open-source in-memory key/value data store, used as a database, message broker, and cache. It is important to monitor Redis instances for performance and availability. There are several tools and metrics that can be used to monitor Redis performance, such as Prometheus, Grafana, Datadog, and Sematext. Some key metrics to monitor include latency, CPU usage, memory usage, and cache hit rate. By tracking these metrics, administrators can identify and address performance issues, ensuring optimal performance of their Redis instances and clusters.
What You'll Learn

Memory monitoring
Memory is a critical resource for Redis, and as an in-memory database, the performance of Redis instances depends on sufficient memory resources. Memory usage can be configured using the maxmemory directive in the redis.config file or by using the CONFIG SET command at runtime. When the memory used by Redis reaches the specified amount, key eviction policies can be used to free up space.
Memory fragmentation issues can lead to reduced performance and increased latency. Memory fragmentation occurs when the operating system is unable to find a contiguous section of memory and instead allocates fragmented memory sections to store Redis data, leading to overhead in memory usage. The memory fragmentation ratio is defined as the ratio of memory allocated by the operating system to used memory by Redis. A fragmentation ratio greater than 1 indicates fragmentation, while a ratio greater than 1.5 indicates excessive memory fragmentation, which can be resolved by restarting the Redis server.
It is important to monitor the memory utilisation of Redis instances to ensure optimal performance. This includes tracking the used memory, peak used memory, and Resident Set Size (RSS). Used memory refers to the memory allocated to Redis by the functionality responsible for managing its memory. Peak used memory indicates the maximum amount of memory consumed by Redis, showing the maximum memory required by the instance. RSS refers to the memory allocated to Redis by the operating system.
In addition to memory metrics, it is also crucial to monitor basic activity metrics such as the number of connected clients, blocked clients, and connected replicas. These metrics can provide insights into the performance and utilisation of the Redis instance.
Identify Pixels: Monitor Troubleshooting Guide
You may want to see also

Latency monitoring
Latency is a critical metric for measuring the performance of Redis, which is known for its low-latency responses. It refers to the maximum delay between a client issuing a command and receiving a reply.
Redis 2.8.13 and later versions have a built-in Latency Monitor feature that helps users identify and troubleshoot possible latency issues. This feature consists of latency hooks that sample different latency-sensitive code paths, time series recording of latency spikes for different events, and a reporting and analysis engine that provides human-readable reports.
To enable the Latency Monitor, set a latency threshold in milliseconds. Only events that exceed this threshold will be logged as latency spikes. This can be done using the following command:
> CONFIG SET latency-monitor-threshold 100
Once enabled, you can use the following commands to interact with the Latency Monitor:
- LATENCY LATEST: Returns the latest latency samples for all events.
- LATENCY HISTORY: Provides the latency time series for a specific event.
- LATENCY RESET: Resets the latency time series data for one or more events.
- LATENCY GRAPH: Generates an ASCII-art graph of an event's latency samples.
- LATENCY DOCTOR: Provides a human-readable latency analysis report.
In addition to the built-in Latency Monitor, you can also use the redis-cli command to quickly check latency:
> redis-cli --latency -h 127.0.0.1 -p 6379
This command continuously samples latency by issuing PING and provides an output with various parameters such as the number of samples, minimum delay, maximum delay, and average response time.
It is important to note that for continuous latency monitoring, a dedicated monitoring system is required. Additionally, CPU usage spikes can impact latency, so it is recommended to investigate high CPU usage and set TTL for temporary keys.
Removing Unmonitored MySQL Instances: A Comprehensive Guide
You may want to see also

CPU usage
To effectively monitor CPU usage, track CPU metrics and identify any spikes or sustained high usage that may require optimization or scaling. This includes monitoring the "used_memory" metric to ensure Redis stays within acceptable limits and prevent issues like out-of-memory errors, performance degradation, and server crashes. Additionally, calculating the memory fragmentation ratio (mem_fragmentation_ratio) is important to understand the degree of fragmentation within Redis, as high fragmentation can lead to slower responses.
By monitoring CPU usage patterns, administrators can enable effective capacity planning, assess load trends, predict scaling needs, and implement optimizations to maximize CPU utilization. This includes setting limitations on resource usage, such as memory limitations, to prevent issues like high CPU usage.
Furthermore, tools like Prometheus and Middleware can aid in monitoring CPU usage and provide deeper insights into this metric. With Middleware, for example, you can set up smart alerts to be notified when specific thresholds are exceeded, allowing for swift identification and resolution of issues related to CPU usage.
Positioning Studio Monitors: How Room Size Impacts Sound
You may want to see also

Connection monitoring
Active, Blocked, and Rejected Connections
Monitor the number of active connections, which are the connections currently in use by clients connected to the Redis instance. Aim to have the number of allowed connections equal to the peak of active connections to balance performance and resource utilisation.
Additionally, keep track of blocked connections, which are those waiting for Redis to complete some internal blocking operation. An increasing number of blocked connections may indicate long-running operations that are delaying client requests.
Rejected connections occur when a client tries to establish a connection but fails because the database has reached its limit on the number of active connections, which is 10,000 by default. Monitor this metric as it indicates an overloaded or poorly configured Redis instance.
Connection Limits and Alerts
Monitor the number of client connections as access to Redis is typically mediated by an application. There should be reasonable upper and lower bounds for connected clients. If the number deviates from the normal range, it could indicate issues with upstream connections or server overload.
Set up alerts for the number of connected clients to ensure you're notified when the limit is approached or exceeded. This will help you proactively manage resources and ensure you have enough capacity for new client connections or administrative sessions.
Connection Performance
Monitor the average time it takes for the Redis server to respond to client requests, as this is a critical indicator of performance. High latency can be caused by various issues, including backlogged command queues, slow commands, or network link overutilisation.
Track the number of commands processed per second to diagnose high latency issues. If the number remains constant, the cause is likely not a computationally intensive command, but rather other factors affecting connection performance.
Connection Errors
Monitor the number of rejected connections due to reaching the maxclient limit. This metric indicates potential issues with your system's ability to handle the requested number of connections, which may be due to operating system, Redis configuration, or network limitations.
Connection Security
Monitor and log all client connections to ensure security and data integrity. This includes tracking the number of failed connection attempts and their sources to identify any potential security threats or unauthorised access attempts.
By following these guidelines for connection monitoring, you can effectively manage and optimise the performance of your Redis instances, ensuring efficient utilisation of resources and maintaining high-performance standards.
Identifying Monitor Types: LCD vs CRT
You may want to see also

Hit rate monitoring
The hit rate can be calculated using the following formula:
> Hit Rate = keyspace_hits / (keyspace_hits + keyspace_misses)
A high hit rate indicates efficient cache utilisation, while a low hit rate suggests that clients are searching for keys that no longer exist. A recommended hit rate is above 0.8; if it falls below this threshold, it may indicate that a significant number of keys have expired or been evicted, or that there is insufficient memory allocation.
Monitoring the hit rate is particularly important when using Redis as a cache. A low hit rate can lead to increased latency as applications have to fetch data from slower alternative resources.
To calculate the hit rate, you can use the Redis INFO command, which provides the total number of keyspace_hits and keyspace_misses. Additionally, tools like Datadog's comprehensive platform offer specialised support for measuring Redis Enterprise performance, including hit rate.
Blind Spot Monitor: Standard Feature on Toyota Models?
You may want to see also
Frequently asked questions
Some of the most important metrics to monitor for Redis performance include latency, memory usage, CPU utilisation, throughput, keyspace, network traffic and bandwidth usage, and logs.
Latency is the time it takes for Redis to process a command or request. Low and consistent latency is crucial for responsive applications. Monitoring latency can help identify slowdowns in application performance.
Memory usage refers to the amount of physical memory consumed by Redis. High memory usage can lead to out-of-memory errors, performance degradation, and server crashes. You can monitor memory usage through commands such as `MEMORY USAGE` and by tracking the "used_memory" metric.
CPU utilisation measures the amount of processing power consumed by Redis. High CPU usage can indicate heavy computational load or inefficient resource utilisation. Monitoring CPU usage helps with capacity planning, load trend assessment, and scaling needs prediction.
Throughput is the number of commands processed per second by Redis. Monitoring throughput helps understand the workload on Redis instances and identify any sudden changes or spikes in traffic.
Monitoring network traffic and bandwidth usage in Redis helps identify potential bottlenecks or network-related issues. Tracking metrics such as incoming and outgoing network traffic ensures optimal network performance.


