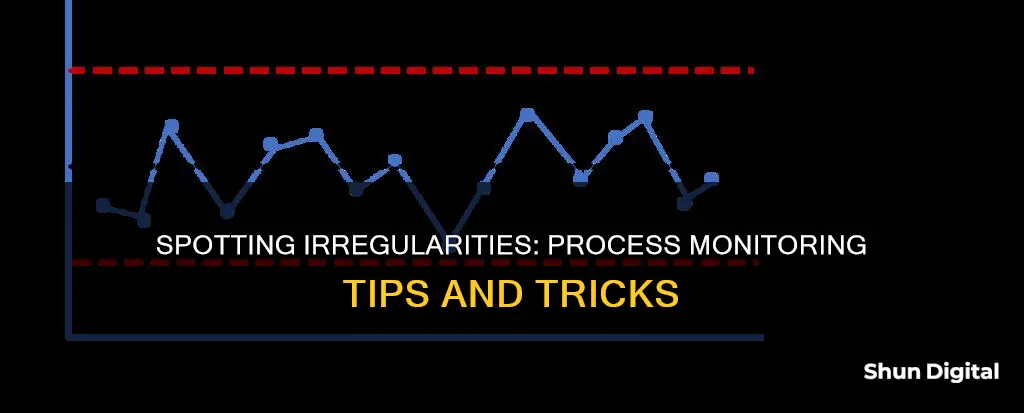
Process Monitor is a versatile tool that can be used to troubleshoot a variety of issues, including application failures, file system issues, registry problems, and misleading error messages. It is an advanced monitoring tool for Windows that provides real-time insights into file system, registry, and process/thread activity. To spot anything irregular in Process Monitor, it is essential to understand its key features and capabilities. By capturing detailed data about system operations, non-destructive filters, thread stacks, and process details, users can identify potential issues or irregularities. Additionally, configurable columns, advanced logging architecture, and the process tree tool aid in analysing the relationships between processes and identifying any anomalies. Familiarity with the help file and exploring the menu items and options in a live system can enhance one's ability to spot irregularities in Process Monitor effectively.
| Characteristics | Values |
|---|---|
| Troubleshooting issues | Application failures, file system issues, registry issues, boot logging, application stack examination, error messages, registry settings for an application |
| Setup | Download Process Monitor, extract the .zip file, run Procmon.exe, click agree to the EULA screen |
| Interface features | View Registry Activity, File System Activity, Process/Thread Activity, event property sheet, Process Tab, Stack tab |
| Boot logging | Enable Boot Logging from the Options Menu |
| Logging | Simultaneous logging to a file, native log format |
| Monitoring and filtering capabilities | More data captured for operation input and output parameters, non-destructive filters, capture of thread stacks, reliable capture of process details, configurable and moveable columns, advanced logging architecture |
What You'll Learn

Troubleshooting application failures
To set up the Process Monitor tool, download and extract the files. Once started, reset any previously saved filters to default to ensure no events are filtered out. You can then start recording by pressing Ctrl + E or by selecting Capture Events from the File menu. The recording should start automatically, and you can reproduce the problem to capture the necessary data.
For example, if you have an application that isn't working, start the Process Monitor recording and then reproduce the problem by trying to start the application. Once the issue occurs, stop the recording and save the data. You can then open the recorded trace with Process Monitor and select "Process Tree" under Tools on the Menu to see if your application started during the recording.
You can also use the "Idle Time" metric to identify instances that are idle beyond a specific time limit and log them off or disconnect them. This is particularly useful in the healthcare sector, where employees share application licenses.
Additionally, you can monitor historical application failures by viewing the "Trends -> Application Failures" tab, which displays failures associated with published applications. The failures are categorized as Application Faults or Application Errors based on their severity. You can filter these failures based on various parameters, such as Published Application Name, Process Name, Delivery Group, and Time Period.
Finding Monitors: Locating Similar Displays to Your Current One
You may want to see also

Monitoring file system issues
File system issues can be monitored by tracking changes to files within servers and distributed environments. This can be done using several automated, streamlined features. One way to do this is by creating a baseline for comparing file characteristics against future changes. For example, monitoring tools can be used to track file changes in real time, such as file age, file count, file size, and title. This allows users to determine the last modification made to a file and track unwanted changes.
Additionally, file monitoring software can send alerts on specific file changes, such as notifying users of potential file integrity issues. These alerts can be customised to notify users of specific file conditions, so that users only receive critical alerts for issues that are of concern. For instance, the software can alert users if the number of files in a directory crosses a predefined threshold.
File monitoring is important for maintaining and validating the integrity of operating systems and application files. It can be difficult to track changes in file characteristics like size, count, and extension in real time, especially in large environments. By monitoring file changes, organisations can remain informed when modifications or unauthorised access occurs to critical system files. This can help organisations address issues in a timely manner and ensure data consistency and availability.
Locating Your LG Monitor: Finding the Serial Number
You may want to see also

Registry issues
The Windows Registry is a database that stores configuration information for the operating system and other applications. It is an important component of Windows, and any changes made to the registry can significantly impact the system's performance and stability.
Using a tool like Process Monitor, you can effectively track and monitor registry changes. This can be useful for troubleshooting issues related to application failures, system instability, or even malware infections.
- Uninstalling Applications: Process Monitor can help identify issues during the uninstallation process. For example, if you encounter an error while trying to uninstall an application, Process Monitor can track down the specific failure. In the case described in the Microsoft Community Hub, the issue was caused by a discrepancy in the file path, which included a space that was not accounted for in the uninstaller.
- Service Startup Failure: Process Monitor can help troubleshoot issues related to service startup failures. In the example provided, there was an "ACCESS DENIED" message when trying to read the service information from a specific registry key. By checking the permissions on this registry key using Process Monitor, it was discovered that the Local Admin group had Deny access. Correcting this issue resolved the service startup problem.
- Permission Issues: Process Monitor can help identify permission issues related to registry keys. In the example provided, there was an issue with the permissions of the following registry key: \HKEY_CURRENT_USER\Software\Microsoft\Windows\CurrentVersion\Explorer\User Shell Folders. By comparing the permissions against a working machine, you can identify and resolve any discrepancies.
- Real-time Monitoring: Process Monitor offers real-time monitoring of registry changes, allowing you to see system files, registry modifications, and processes/threads. This can be particularly useful for identifying issues as they occur and understanding the impact of specific actions or configurations.
- Error Message Troubleshooting: Process Monitor can help troubleshoot misleading error messages. By examining the registry activity and related information, you can identify the root cause of the issue and take appropriate action.
In summary, Process Monitor is a valuable tool for addressing registry issues. It provides visibility into registry changes, permissions, and related system activities, enabling effective troubleshooting and issue resolution.
Troubleshooting LCD Monitor Issues: What Could Be Wrong?
You may want to see also

Boot logging
To enable boot logging in Windows 10, open the Control Panel and click on System and Security. Under Security, select Advanced System Settings, then click the Advanced tab and select the Settings button under Startup and Recovery. Check the box next to 'Write an event to the system log' and click OK. This will create the log file, which can then be used to identify and troubleshoot any issues that may be occurring during the boot process.
Monitoring JVM Heap Usage: Practical Tips for Performance Optimization
You may want to see also

Examining application stack
Examining an application stack is a crucial aspect of troubleshooting and can provide valuable insights into the inner workings of a system. An application stack refers to a collection of functions and components that work together to deliver specific functionalities.
In the context of troubleshooting, examining the application stack involves analysing each layer of the stack to identify potential vulnerabilities and issues. This process, often referred to as "walking the stack", breaks down a complex application into multiple smaller targets, making it easier to identify and address problems.
The application stack can be broadly categorised into several layers, including the web server, application server, database tier, and integration layer. Each layer has its own set of vulnerabilities that can be exploited. For instance, the web server layer may have vulnerabilities in the host operating system, web server software, default files, or poor configuration.
By examining the application stack, we can identify weaknesses in the system's security, such as out-of-date software, unnecessary services, insecure account policies, and verbose error messages. This information can then be used to implement effective security measures, such as following security hardening practices and defining secure configurations.
Additionally, examining the application stack can help in troubleshooting specific issues, such as application failures during installs, uninstalls, or launch failures. By analysing the stack, we can identify errors and resolve them, as demonstrated in the example of troubleshooting an issue with the PowerGadgets application.
Furthermore, the application stack plays a crucial role in penetration testing, where the objective is to compromise one or more levels of the stack. By understanding the stack, penetration testers can employ various tools and techniques to identify vulnerabilities and gain unauthorised access.
In summary, examining the application stack is a comprehensive process that involves analysing each layer, identifying vulnerabilities, and implementing appropriate security measures. It is a fundamental aspect of ensuring the security and functionality of a system, as well as troubleshooting and resolving any issues that may arise.
LCD Monitors: Creating Color with Light and Crystals
You may want to see also
Frequently asked questions
You can download Process Monitor from the Microsoft website.
Run Process Monitor with elevated permissions, then reproduce the problem by attempting to start the application. Once the issue is reproduced, stop the Process Monitor recording and save the data.
Configure Process Monitor to log activity early in the boot process by selecting "Enable Boot Logging" from the Options Menu.
Process Monitor can be used to simultaneously trace file and registry information.


