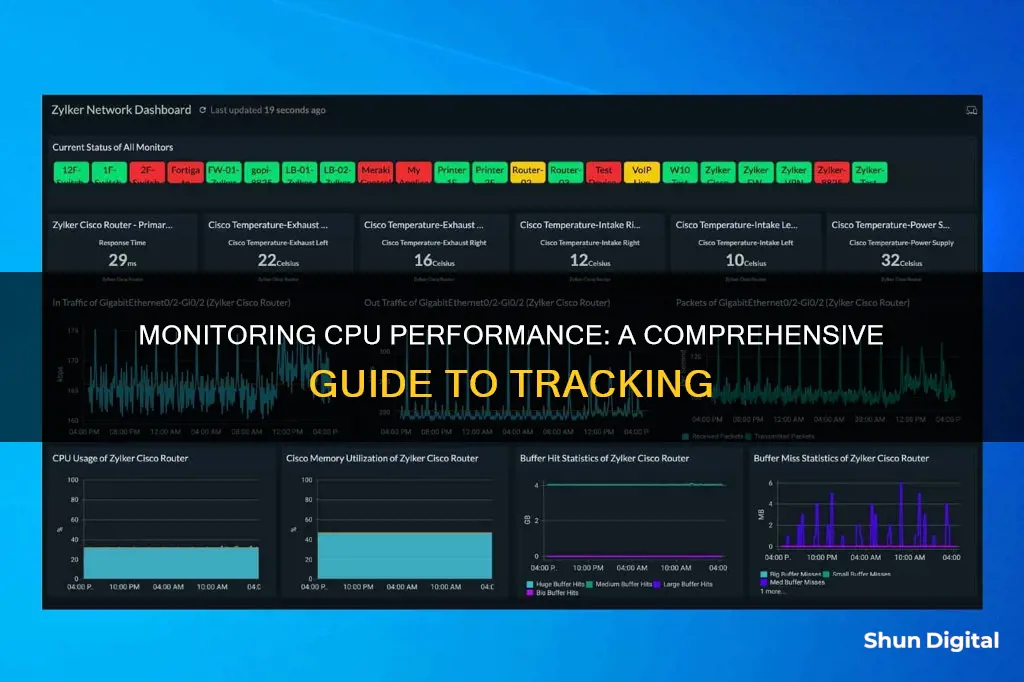
Monitoring CPU performance is a crucial aspect of network management and can be the difference between a stable network and deteriorating network performance. The central processing unit (CPU) is the core component of any networked device, and its performance directly impacts the speed and stability of the device and network as a whole. High CPU usage can cause a server to crash, so it's important to keep an eye on it and take action if it starts to spike. Effective CPU monitoring tools will analyse metrics such as utilisation, load, temperature, and fan speed, and alert IT administrators if usage passes a certain threshold.
| Characteristics | Values |
|---|---|
| CPU Usage | Monitored using tools such as OpManager, SysGauge, SolarWinds Network Performance Monitor, and Microsoft Performance Monitor |
| CPU Utilization | Can be monitored using the % Processor Time counter |
| CPU Load | Monitored by tools like SolarWinds Engineer's Toolset and OpManager |
| CPU Temperature | Monitored by OpManager |
| CPU Speed | Monitored by OpManager |
| CPU Health | Monitored by OpManager |
| CPU Bottlenecks | Tracked by OpManager |
| CPU Fan Speed | Monitored by SolarWinds Network Performance Monitor |
What You'll Learn

CPU load monitoring
Using Task Manager
Open the Task Manager by pressing Ctrl + Shift + Esc and navigate to the "Performance" tab. Here, you'll see a graph displaying the CPU usage. If you need more detailed information, go to the "Processes" tab to sort processes by CPU usage and identify any processes causing high usage.
System Tray
Look for the CPU usage icon in the bottom right corner of your screen (system tray). If your computer has high CPU usage, the icon will indicate the amount of used and available CPU.
Command Prompt
Open the Command Prompt by searching for it in the Start menu, then type "wmic cpu get loadpercentage" and press Enter. This will display the current CPU usage percentage.
Third-Party Tools
Third-party tools like Process Explorer, Task Manager Deluxe, and CPU-Z can provide more detailed insights into CPU usage. They help identify which programs and processes are utilizing the most CPU resources.
CPU Monitoring Software
Dedicated CPU monitoring software, such as SolarWinds Network Performance Monitor, ManageEngine OpManager, and SysGauge, offer advanced features for monitoring CPU load. These tools allow you to set thresholds, receive alerts, and generate reports on CPU usage. They also provide visual representations of data, making it easier to interpret and analyze CPU performance.
Uninstalling Epson Status Monitor: A Step-by-Step Guide
You may want to see also

CPU temperature monitoring
BIOS/UEFI Monitoring:
When you boot up your system, you can access the BIOS or UEFI firmware to view the CPU temperature. This information is typically found in a Hardware Monitoring section and may include temperatures for each core, fan speeds, voltages, and power consumption metrics. Not all motherboards list the CPU temperature, but it is common in enthusiast or DIY motherboards. To access the BIOS, simply reboot the system and repeatedly press Delete or F2 during the startup process.
Software-Based Monitoring:
Software-based tools provide an easy and convenient way to monitor CPU temperature. These tools read the temperature data from the CPU's sensors, either through the BIOS or directly from the operating system, and display it in a user-friendly format. Examples of such tools include Core Temp, NZXT CAM, HWMonitor, and Open Hardware Monitor. These tools often offer additional features like fan speed monitoring and customizable alerts.
Factors to Consider:
It's important to note that CPU temperature readings can be influenced by various factors:
- Ambient Temperature: The surrounding environment's temperature can impact the CPU temperature.
- Cooling Solution: Insufficient cooling measures, such as an inadequate CPU cooler, can cause temperatures to rise.
- CPU Load: During intensive tasks like gaming or video rendering, the CPU generates more heat, leading to higher temperatures.
Safe CPU Temperatures:
To ensure the optimal performance and health of your CPU, it's crucial to maintain safe temperature ranges. For Intel processors, an idle temperature of around 50°C is considered ideal, while under higher loads, it's best to keep the temperature under 80°C. For AMD processors, the temperature should ideally not exceed 70°C under full load. However, it's important to refer to the specifications of your specific processor, as some newer chips are designed to operate at higher temperatures.
LCD Monitor Overheating: Why It's Hot and How to Fix It
You may want to see also

CPU usage monitoring tools
CPU monitoring tools are essential for effectively managing and maintaining network performance. They can help keep you updated on issues as they develop and speed up troubleshooting by providing insights into root causes.
- SolarWinds Network Performance Monitor (NPM): This software offers a wide range of network monitoring utilities, including hop-by-hop analysis and cross-stack network data correlation. It monitors, alerts, and reports on key CPU metrics such as utilisation, load, temperature, and fan speed. It also allows you to customise performance and availability reports using templates. The tool provides real-time metrics and interactive charts and graphs for visual representation.
- SolarWinds Engineer's Toolset (ETS): This software combines over 60 tools for system administrators, including DNS audits, MAC address scanning, memory monitoring, and response time monitoring. Its CPU monitoring features include a CPU Gauge, CPU Load Monitor, CPU Monitor, and Router CPU Load tool. ETS also includes an auto-discovery utility to detect connected network devices.
- Ipswitch WhatsUp Gold: This software offers seamless integration capabilities with a robust REST API. It has intelligent alerts informed by topology-aware monitoring, an auto-discovery engine, and an interactive map view of the network. It also allows you to view the minimum, maximum, and average CPU utilisation of network devices.
- Paessler PRTG Network Monitor: This software provides flexible network monitoring with customisable functionalities. It includes more than 50,000 sensors, with over 200 preconfigured sensors for CPU usage monitoring. It also has an alerts system that can notify you via SMS or email if CPU utilisation exceeds predefined thresholds.
- ManageEngine OpManager: This software monitors CPU metrics such as utilisation, socket, speed, idle time, PSU redundancy, and processor time. It features intelligent, threshold-based alerts that can be configured for each CPU metric, with defined violations that trigger an alarm. Alerts can be received via email or SMS.
- CloudRadar: This software covers more than 50 CPU metrics in a unified dashboard, providing a real-time overview. It has a threshold-based alerts system and an auto-discovery feature for performance data gathering. CloudRadar offers pay-per-device monthly plans, making it attractive for smaller networks.
- SysGauge: This Windows CPU monitor has a simple interface and offers features such as reporting on CPU frequency, interrupt rate, interrupt time, and overall usage. It allows users to set their own alert parameters, triggering email notifications when breached. It also supports custom commands for responding to CPU performance issues.
Ultimate Guide: Choosing the Right Monitor
You may want to see also

CPU performance monitoring
There are several tools available for monitoring CPU performance, including:
- SolarWinds Network Performance Monitor (NPM): This software offers a range of network monitoring utilities and serves as a powerful Windows CPU monitor. It monitors, alerts, and reports on key CPU metrics such as utilisation, load, temperature, and fan speed. It also provides real-time data visualisations, allowing for dynamic and visual analysis of CPU usage.
- ManageEngine OpManager: This tool allows users to monitor CPU utilisation, socket, speed, idle time, PSU redundancy, and processor time. It features intelligent, threshold-based alerts that can be configured for each CPU metric, ensuring users are promptly notified of any issues.
- Engineer's Toolset (ETS): Another offering from SolarWinds, ETS combines over 60 tools for system administrators, including CPU monitoring capabilities. It includes a CPU Gauge, CPU Load Monitor, CPU Monitor, and Router CPU Load tool. ETS provides visual representations of data, such as graphs and tables, making it easier to interpret results and identify issues.
- SysGauge: Designedsection-title-ss-5-2-wh:> Designed for simplicity, SysGauge has a clean interface and offers a range of CPU metrics such as CPU frequency, interrupt rate, interrupt time, and overall usage. Users can set their own alert parameters and execute custom commands to respond to CPU performance issues.
- Microsoft SQL Server: This tool allows users to periodically monitor Microsoft SQL Server to determine if CPU usage rates are within normal ranges. It uses the Processor:% Processor Time counter to monitor the amount of time the CPU spends executing non-idle threads. For multiprocessor systems, separate instances of this counter can be monitored for each processor.
These tools provide system administrators with valuable insights into CPU performance, enabling them to optimise network performance, identify potential bottlenecks, and take proactive measures to ensure stable and efficient operations.
Allen Wrench Sizes for Delta Monitor Troubleshooting
You may want to see also

CPU health checks
Understanding CPU Metrics:
- CPU Usage: This measures how much of the CPU's processing capacity is being utilized at a given time. High CPU usage can lead to slowdowns and crashes, so it's important to monitor this metric regularly.
- Utilization: Refers to the percentage of time the CPU spends executing non-idle threads. Consistently high utilization (80%-90%) may indicate the need for an upgrade or additional processors.
- Load: The amount of work the CPU is handling, which can be measured against its maximum capacity.
- Temperature: Monitoring CPU temperature is crucial to prevent overheating, which can damage the CPU and other components.
- Fan Speed: An important factor in maintaining CPU temperature.
- Socket: The physical connection between the CPU and the motherboard.
- Speed: Refers to the clock speed or cycles per second of the CPU.
Choosing a CPU Monitoring Tool:
There are several software tools available for monitoring CPU performance, such as:
- SolarWinds Network Performance Monitor: Offers real-time CPU metrics with interactive charts and graphs for data visualization.
- Engineer's Toolset: Also by SolarWinds, this tool includes a range of CPU monitoring features such as a CPU Gauge, CPU Load Monitor, and visual representations of data.
- ManageEngine OpManager: Allows monitoring of CPU fundamentals like utilization, socket, speed, idle time, and processor time. It also has a threshold-based alerts system.
- SysGauge: A simple and functional CPU monitor with a clean interface. It allows users to set custom alert parameters and execute custom commands.
- Paessler PRTG Network Monitor: A flexible solution that allows users to customize functionalities according to their system requirements through sensor-based packages.
Setting Up CPU Monitoring:
Once you've chosen a suitable tool, follow the instructions provided by the software to set up CPU monitoring:
- Select Relevant Counters: In tools like Perfmon, you can add counters such as "% Processor Time" to monitor CPU usage for each process separately.
- Visualize Data: Utilize graphs, charts, or widgets to visualize CPU usage data, making it easier to interpret and identify trends.
- Set Thresholds and Alerts: Define alert thresholds for metrics like CPU load and temperature. Many tools allow you to receive alerts via email or SMS when these thresholds are reached.
Taking Action:
Based on the data and alerts from your CPU monitoring tools, take appropriate actions to maintain optimal CPU performance:
- Upgrade Hardware: If CPU usage or temperature consistently exceed healthy levels, consider upgrading to a faster CPU or adding more processors.
- Optimize Applications: High CPU usage may be caused by poorly designed or tuned applications. Optimizing these applications can reduce CPU utilization.
- Improve Disk Subsystem: If the "% Privileged Time" counter is high when Physical Disk counters are also high, installing a faster or more efficient disk subsystem may help.
Monitoring Folder Sizes: Strategies for Effective Data Management
You may want to see also
Frequently asked questions
CPU usage monitoring is tracking how much of a CPU is being used and how much is left to run server operations. CPU usage directly influences network performance, so it's necessary to monitor CPU utilisation with a CPU usage monitor.
You can monitor CPU usage with a CPU usage monitoring tool such as OpManager, SolarWinds Network Performance Monitor, or SysGauge.
CPU usage monitoring can help you identify how well a device is performing and how its performance might be affecting your network. It can also help you determine whether you need to upgrade your CPU or add more processors.
CPU metrics include utilisation, load, temperature, fan speed, socket, speed, idle time, and processor time.


