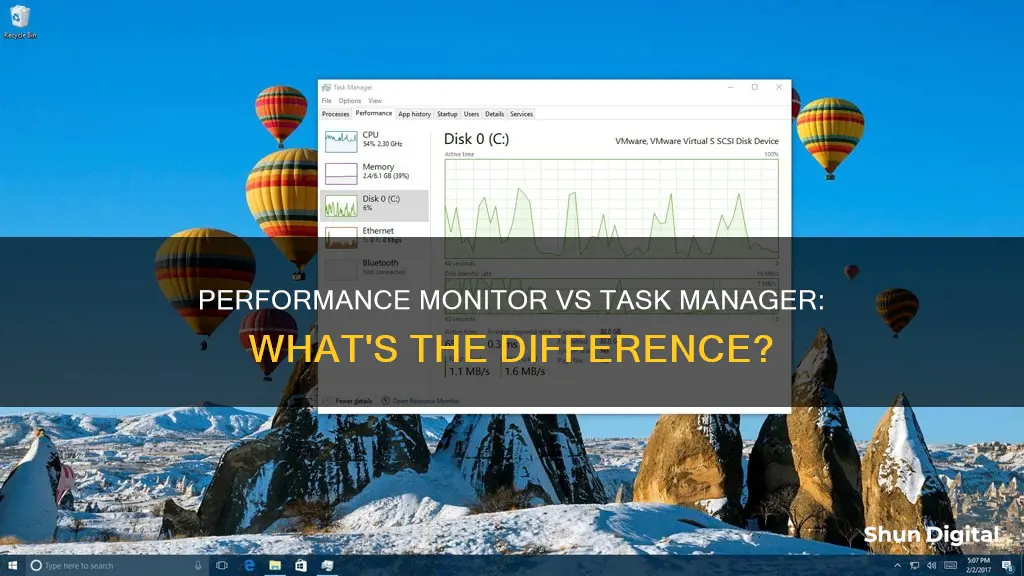
Performance Monitor and Task Manager are both tools used to monitor the performance of a computer system. Performance Monitor, also known as System Monitor, is a system monitoring program in Windows that can be used to monitor various activities on a PC, such as CPU or memory usage. It provides a quick summary of overall CPU, disk, network, and memory usage. On the other hand, Task Manager is a well-known tool for monitoring processes on Windows systems. It shows how individual processes use system resources and allows users to kill any processes they choose. While Task Manager gives an overview of how processes use system resources, Performance Monitor provides more detailed real-time information and allows users to monitor any selection of a huge set of system counters.
What You'll Learn
- Performance Monitor provides a summary of overall CPU, disk, network, and memory usage
- Resource Monitor allows you to check the counters for specific system processes and services
- Performance Monitor helps access and report information about various computer resources
- Resource Monitor helps monitor the usage of your CPU, RAM, Disk, and Network
- Performance Monitor is included in Windows 11/10

Performance Monitor provides a summary of overall CPU, disk, network, and memory usage
Performance Monitor is a system monitoring program in Windows that provides a quick summary of overall CPU, disk, network, and memory usage. It is also known as System Monitor and is included in Windows 11 and 10. It is a useful tool for identifying the cause of computer problems by measuring the performance of hardware components, software services, or applications.
Performance Monitor acts as both a real-time and log-based performance monitoring tool for operating systems. It measures performance by making system calls to retrieve system counters and provides an interface to monitor a huge set of system counters on a graph in real time. It offers counters such as percentage of processor time, thread count, page fault rate, memory size, and elapsed time for processes.
The main window of Performance Monitor displays a graph of all selected system counters updated in real time at a specified rate. It is highly customizable, allowing users to choose between a graph or histogram representation and assign colours to certain counters. Users can also set up alerts that will trigger an action when a specified counter exceeds a defined threshold.
Compared to Task Manager, Performance Monitor provides a more detailed and extensive level of information, making it ideal for monitoring resource usage and performance of a Windows system. While Task Manager is a fast and well-known tool for monitoring processes, Performance Monitor offers a broader set of system counters and the ability to monitor any selection of them in real time.
Ankle Monitor Malfunction: What's the Worst That Could Happen?
You may want to see also

Resource Monitor allows you to check the counters for specific system processes and services
Resource Monitor is a program that displays information about hardware and software resources in real-time. It is included in several versions of Windows and can be accessed through the Windows Run box by typing "resmon.exe" or "perfmon.exe /res", or by navigating to the Windows Administrative Tools folder. The interface is divided into tabs for Overview, CPU, Memory, Disk, and Network, each providing detailed information about resource usage.
The Overview tab gives a general summary of resource usage, including CPU and memory usage, disk utilisation, and network use. The CPU tab provides a more detailed breakdown of CPU utilisation, including process names and IDs, while also listing services, associated handles, and associated modules. The Memory tab focuses on memory usage, with a physical memory view that shows the distribution of memory across the system. The Disk tab visualises disk usage and lists disk activity for each running process, while the Network tab details network activity, TCP connections, and listening ports.
One key advantage of Resource Monitor over Task Manager is the ability to filter information. For example, selecting a specific process under the CPU tab will display only the disk, network, and memory usage of that process. This level of detail can be useful for troubleshooting and identifying resource bottlenecks.
Resource Monitor also provides some control over processes and services. Right-clicking on a process in the CPU tab, for instance, brings up options to end the process, suspend or resume it, or search online for more information.
Kia Soul: Blind Spot Monitoring Feature Explained
You may want to see also

Performance Monitor helps access and report information about various computer resources
Performance Monitor, also known as System Monitor, is a system monitoring program in Windows. It helps users access and report information about various computer resources, including CPU, disk, network, and memory usage.
Performance Monitor acts as both a real-time and log-based performance monitoring tool for operating systems. It measures performance by making system calls to retrieve system counters and provides an interface to monitor a huge set of system counters on a graph in real time. It offers counters for percentage of processor time, thread count, page fault rate, memory size, and elapsed time for processes.
The main window for Performance Monitor is a graph of all selected system counters updated in real time at a specified rate. Almost everything on this display is customizable, from the graph type to the colours assigned to certain counters. The current reading and statistical information are displayed for the selected counter as the graph updates.
Performance Monitor also allows users to set up alerts that will trigger an action when a specified counter exceeds a defined threshold. For example, alerts can be set up to log an entry, send a message, or run a command or program when a counter exceeds a user-set threshold.
Performance Monitor is a valuable tool for monitoring resource usage and performance of Windows systems. It provides detailed information about various computer resources, allowing users to identify and address any issues.
Testing LCD Monitors: A Step-by-Step Guide
You may want to see also

Resource Monitor helps monitor the usage of your CPU, RAM, Disk, and Network
Resource Monitor is a tool that was introduced by Microsoft as part of its Windows Vista and Windows Server 2008 operating systems and has been included in every new Windows version since then. It is a useful tool that helps monitor the usage of your CPU, RAM, Disk, and Network.
The Resource Monitor interface has five tabs: Overview, CPU, Memory (RAM), Disk, and Network. When you first launch the application, it displays an 'Overview' tab that provides basic system resource usage information for the other four main tabs. The sidebar shows graphs that highlight the usage of each component over a period of 60 seconds.
The CPU tab displays the total percentage of CPU capacity currently in use, with blue indicating the maximum CPU frequency. The Memory tab shows the memory being consumed by each of the running processes, along with graphs that provide a quick view of what physical memory is being used for. The Disk tab shows processes engaged in disk activity, including read-write activity. The Network tab displays which programs are accessing the network and their associated IP addresses.
Resource Monitor offers more detailed insights than the Task Manager and combines the functionality of previous individual tools such as System Monitor, Performance Logs and Alerts, and Server Performance Advisor into a single interface. It provides a deeper view of system activity and resource usage, allowing users to monitor and adjust processes efficiently.
Ankle Monitors: Record Conversations in Texas?
You may want to see also

Performance Monitor is included in Windows 11/10
Performance Monitor is a built-in utility on Windows 10 and 11 that provides system and performance monitoring. It was introduced in Windows NT and has been included in all versions since.
Performance Monitor allows you to monitor your system resource usage in real time and generate log files for later analysis. It provides an extensive level of detailed information, making it ideal for monitoring resource usage and performance.
To open Performance Monitor in Windows 11/10, you can use any of the following methods:
- Press Win+R, type "perfmon" in the Run box, and hit Enter.
- Open the Start Menu, type "Performance Monitor," and click on the app in the search results.
- Press Win+F, type "perfmon" in the Search bar, and hit Enter.
- Open Command Prompt or PowerShell, type "perfmon.exe," and hit Enter.
- Open the System Configuration Tool, select the "Tools" tab, select "Performance Monitor," and click "Launch."
- Open Computer Management, select "Performance" on the left, expand "Monitoring Tools," and click on "Performance Monitor."
Performance Monitor is a powerful tool for monitoring your computer's performance and can provide valuable insights for troubleshooting and optimisation.
Best Monitors for Xbox Series X Revealed
You may want to see also
Frequently asked questions
Performance Monitor, also known as System Monitor, is a system monitoring program in Windows that monitors various activities on a PC like CPU or memory usage. Task Manager, on the other hand, is probably the most well-known tool for monitoring processes on the Windows operating system. It shows how individual processes use system resources and allows system administrators to kill whichever they choose to end. Performance Monitor provides a quick summary of overall CPU, disk, network, and memory usage, while Task Manager gives an overview of how individual processes use system resources.
Yes, Performance Monitor can be used to monitor CPU, disk, memory, and network usage. It provides a quick summary of overall CPU usage and can help identify the cause of computer problems by measuring the performance of hardware components.
To open Performance Monitor on a Windows system, press Windows + R, type perfmon.exe in the Run dialog, and press Enter.


